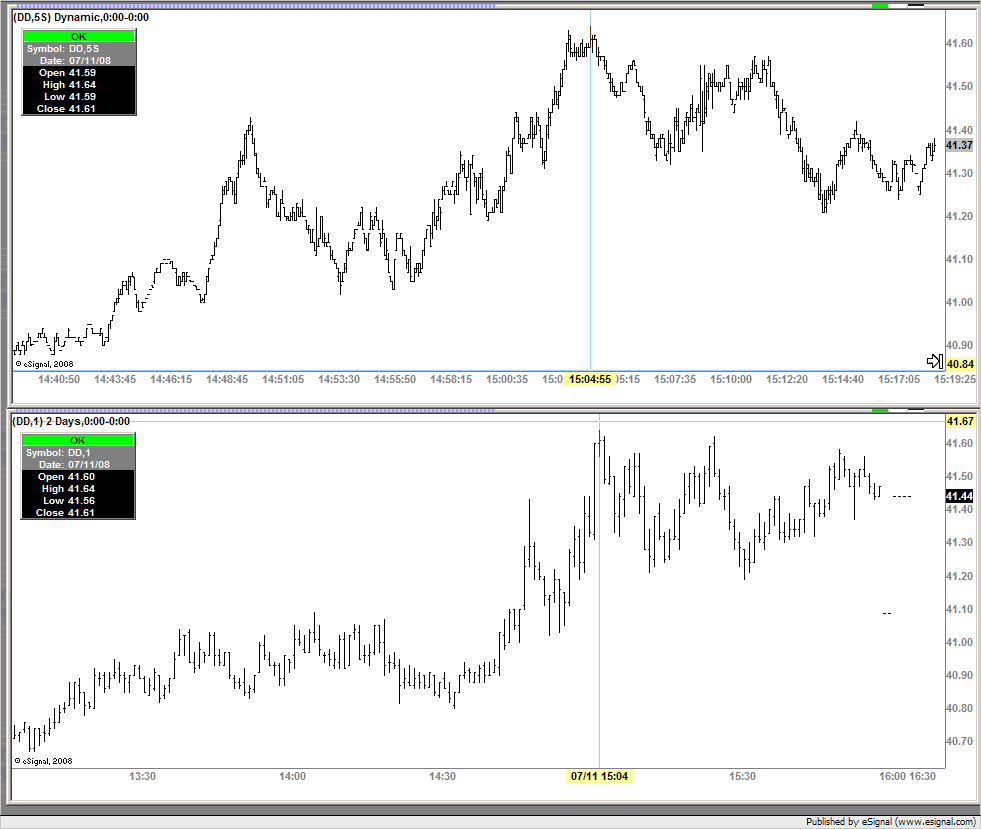
See DD chart shows 3 and 8 min gaps around 15:00 EST on Friday 11th, and that included the high of the day.
The chart was drawn at the weekend (ie not "live" data).
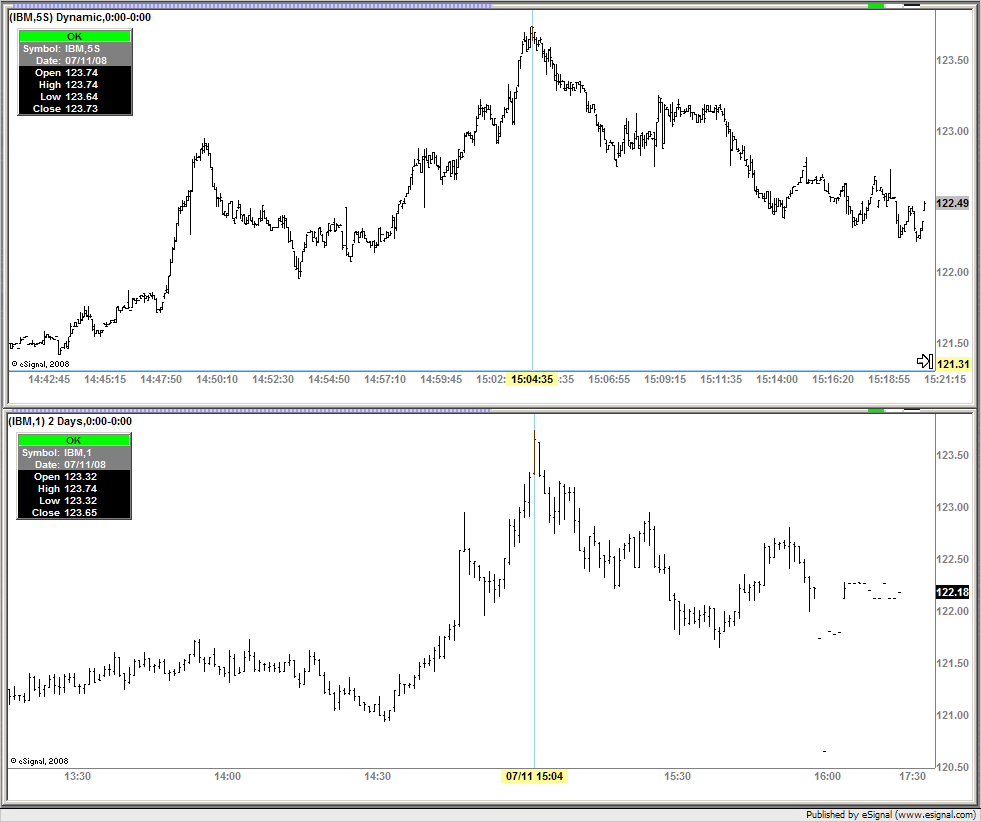
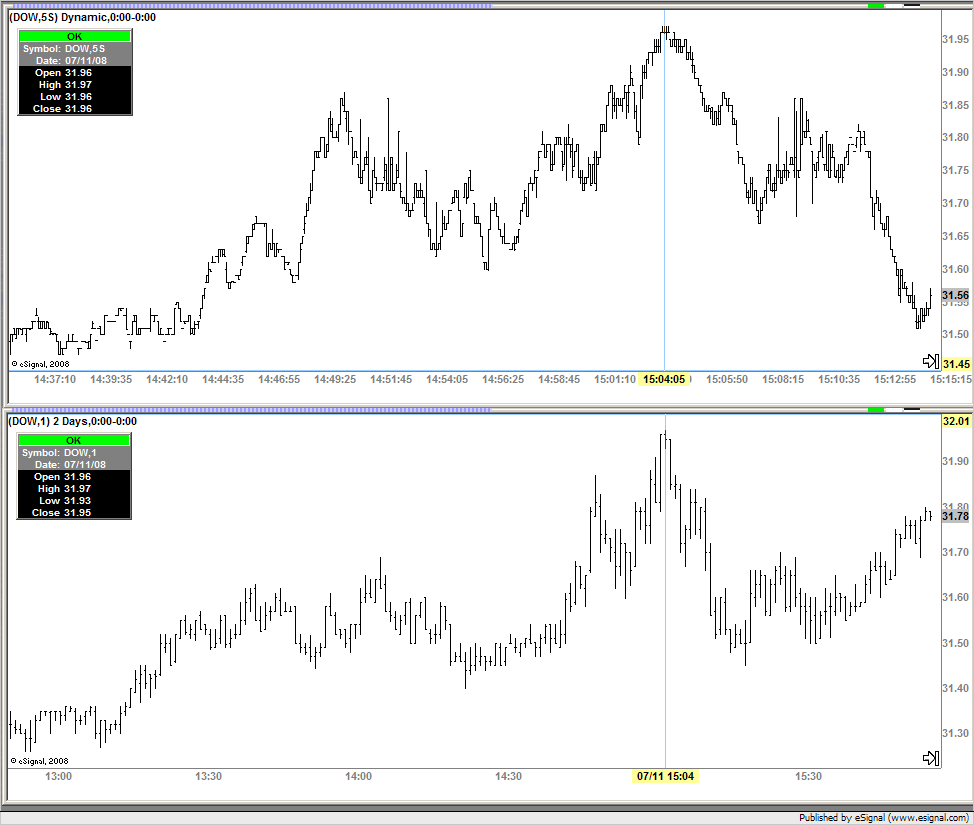
And having a quick look at IBM and DOW I also see the 8min gap, so presumably occured on other stocks too?
Stockcharts has the data for DD at least, so can't be a complete "exchange" fallover (and I don't think they correct intraday errors, so must have had a continuous feed).
What happened?


Comment