 Tweet
Tweet
There is a serious problem of missing data both for historical and real time advanced charts for Japan market, sub-minute time intervals.
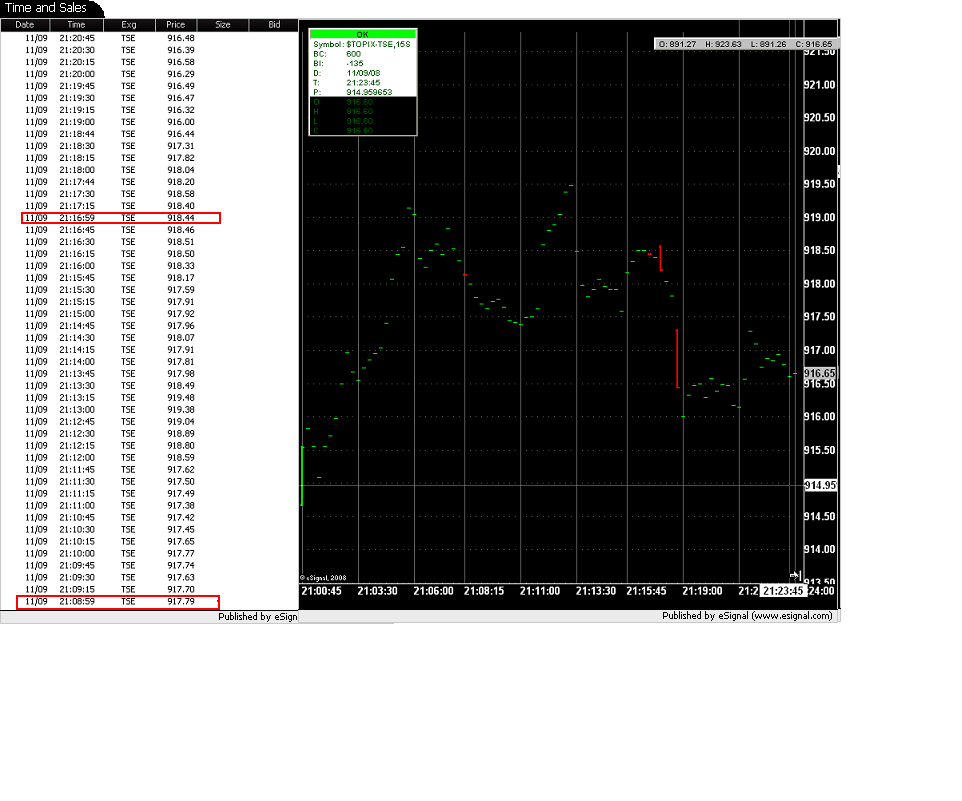
For example, for $topix-tse, quarter of a minute time interval (15seconds), 10 data points are missing for the first 20 minutes this morning from 9:00 to 9:20, exchange time. The following are the missing points.
9:09:00, 9:11:00, 9:13:30, 9:15:15, 9:15:30, 9:15:45, 9:16:00, 9:20:15, 9:20:30, 9:20:45.
The problem is just as bad throughout the day and every day.
Could the moderator please pass on the information about this problem to someone who can address it? Thank you.
Comment