 Tweet
Tweet
Hello
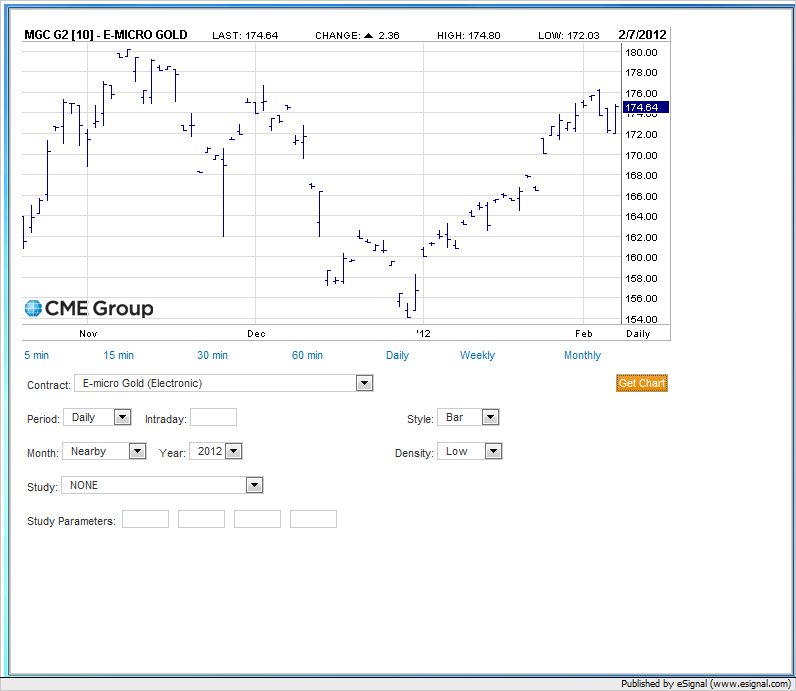
I track the CME micro Gold contract. The actual contract ist MGC J2, but the continous contract MGC #F shows the February contract MGC G2 with poor volume and a wide spread. It seems, that the continous contract don't roll over correct.
In addition, eSignal shows a 175.00 value when it is 1750.0 on CME.
Peter
Comment