Hello,
Been using esignal 10.6 and decided to finally think about checking out 11.
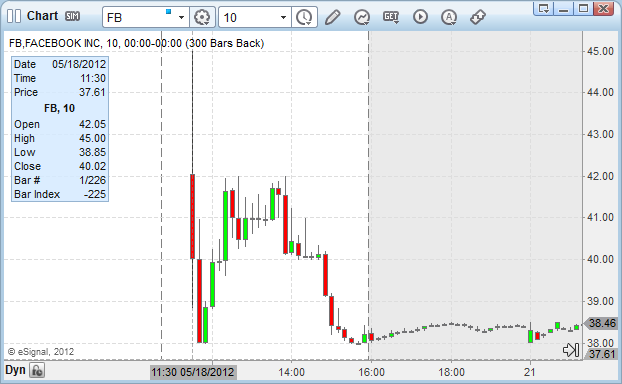
Looks good but the candlestick charts are completly different to 10.6 - I see more information on 10.6 then on 11?
ie, lets take for example Facebook (FB). Looking at the day it opened I see that some candles show large vix and larger body on 10.6 then on 11. In fact, even the numbering makes no sense on 11.
On Facebook the first candle on 10.6 shows at 11:30am:
Open: 42.05
Close: 40.01
High: 45.00
Low: 38.85
However, on 11 it shows:
Open: 38.36
Close: 38.33
High: 38.36
Low: 38.33
How can I use v11 when the data is completely wrong??! I see this not just on FaceBook but on multiple stock charts - I cannot use this product if the basic figures are incorrect!
I have even attached screenshots of what I am seeing.
Am I being dumb in not setting something or is the product showing some weird figures?!
Thanks,

Comment