 Tweet
Tweet
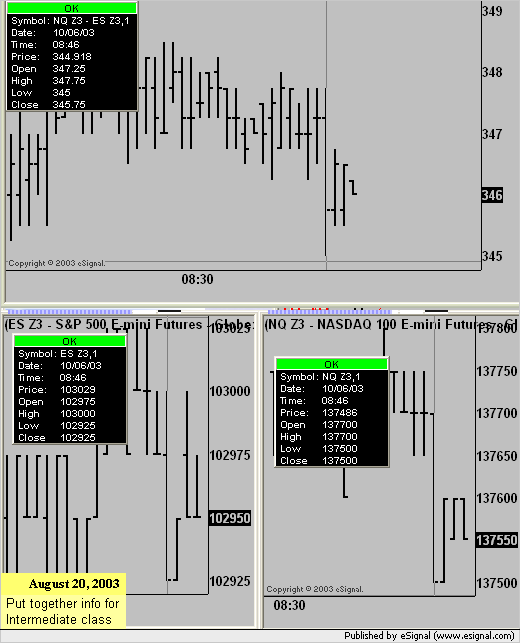
I have a problem with a bar chart of the emini Nasdaq 100 – emini S&P 500 spread. (NQ Z3 – ES Z3).
The high and low of each bar is wildly out of range. Highs are too high and lows too low. Open/Close and current values seem to be correct.
I checked the bars against another charting program (CQG) and watched them live to verify the problem.
It occurs over any time frame – 60 min, 5 min, daily, etc.
I emailed tech support and they seem clueless.
Comment