 Tweet
Tweet
There should be the ability to look at total open interest and volume for all futures in a series. For example, I want to see volume and o.i. not just December 2003 T-Note futures, but all T-Note futures. This is important since a drop in o.i. and volume in current front month is normal as rollover occurs.
-
-
That's a pretty easy one!
Just right-click on any of the underlying futures ( US Z3 for ex ) and select Autolist. You'll get a list of all the active contracts for the underlying symbol.
If that's not what you're looking for, please elaborate.
Thanks. -
sposer
In addition to Scott's suggestion if you want to see them on a chart you could use the attached efs where you can define the symbol for the open Interest.
In a following message I will post a similar one for Volume
Alex
Comment
-
sposer
Attached here is the equivalent for Volume
AlexComment
-
o.i. and volume
Thanks Alexis - you are more on target here. I want to be able to chart volume and/or open interest for all outstanding contracts, so I can probably just modify your code to sum those numbers up and show one chart. I have not done any efs programming yet, but as a former programmer, I suspect that I can figure it out!Comment
-
Did anybody ever manage to get Alexis' study to sum all future's contracts volume when looking at a market?
I'm looking at the study now, but summing volume for all contracts within a symbol is beyond what little level of hacking I'm capable of
jamesComment
-
Alexis/Scott
Alexis is on the right track. I want to see on a chart A SINGLE BAR for each day that shows the summed up o.i. for all contracts of a given type. That is, sum up the bars that Alexis shows for all TYs regardless of which TY is showing on the chart.Comment
-
sposer
I believe that can be done, however an efs can access up to a maximum of 5 symbols. How many different TY contracts are you thinking of summing up?
AlexComment
-
Alexis,
I think the thought was to show total volume & open interest in a market while graphing only one contract. If an EFS study can only sum five contracts within a symbol, then the first 5 contracts would need to be summed.
Obviously, this doesn't capture the total volume and open interest in a market (think crude oil where volume and open interest is substantial in the back months), but in something like the currencies and treasuries it would capture just about all of the volume & OI. Hopefully either the limitation of only 5 contracts can be overcome, or we'll just have to learn to live with it and use it as an approximation.

james
PS: for clarification TY = 1 symbol and TYM4 = 1 contract
I know we're mixing and matching the two terms...I just wanted to be clearLast edited by arvane; 03-19-2004, 04:01 AM.Comment
-
James
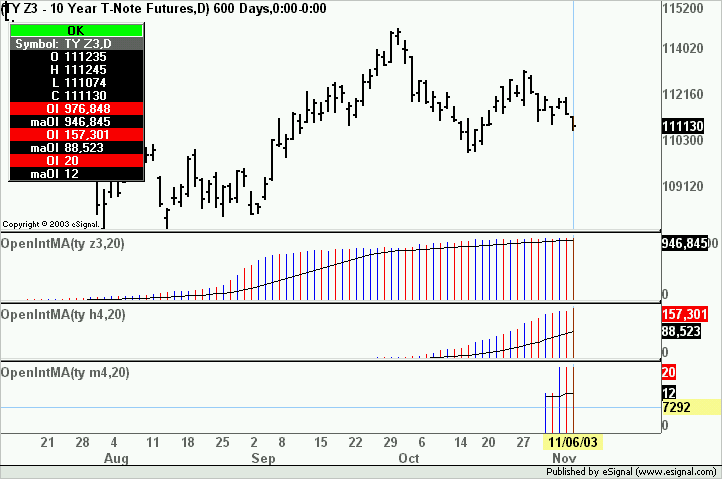
The attached efs is an example of how it can be done. It is essentially the same OpenInt(Sym)MA.efs posted in an earlier message slightly revised to plot the sum of the OI values of TY M4 and TY U4.
For purpose of this example I disabled the MA portion but that can be added back in if desired (it will have to be modified). All revisions in the efs are commented.
This should give you an idea as to how to add the other contracts.
AlexComment
-
Alexis,
Thanks for that! That'll save this hack loads of time. Is there a way to have the contracts set dynamically as opposed to hard coding them into the EFS study?
I suspect there is not since that would entail some sort of list function to retrieve then significant month letters within a symbol.
-jamesComment
-
James
I would not know if there is a way to do that. Irrespective the symbols can be easily modified through Edit Studies.
Later, if I find some time I will add the MA back in the efs
AlexComment
-
Alexis - thanks for all the help...again!
best,
jamesComment
-
Thanks
Alexis -
Thanks alot. And since TY is the contract I look at the most, this will be of immediate help.
As Arvane noted, for the majority of futures contracts, five will not be a problem. But, things like oil and the eurodollar deposit and fed funds futures, this will not give a complete picture.
It might not be exact, but it will be close enough for stuff like TY, US and the stock market futures. This really should be an upgrade to E-Signal as an option in the volume and open interest studies as the total open interest is what is relevant.Comment
-
James, sposer
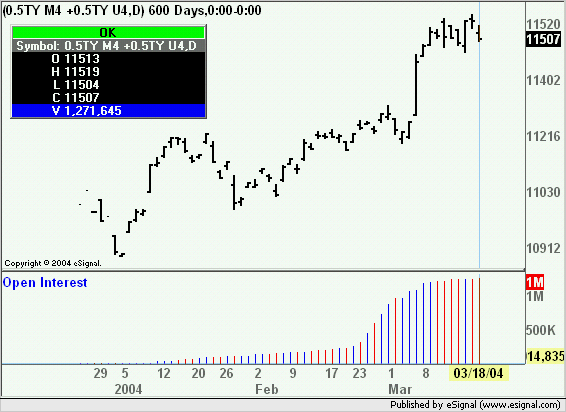
Do consider also the option of creating spread charts that will return the same result of total OI or Volume (without the limitation of 5 symbols)
In the image below I simply added TY M4 and TY U4 (and divided the resulting plot by half) and as you can see the OI value is exactly the same as the one returned by my efs for the same contracts
Alex
PS. As an aside an interesting new feature of 7.6 is that it will return spreads in the original price format. In the past a spread on treasuries was returned in decimal format whereas now it is in 32nds (and a half for TY)
Comment
Comment