I am new at eSignal, and I don't find how to change the date range of a chart : daily charts go back to 1998. Monthly charts go back further.
How can go back further with daily data?
Thanks
anne144
With a Time Template (right click chart select Time Templates-Edit).
The Time Templates control how much data is shown in any Advanced Chart.
If you set the #Days (or #Bars) for a specific interval then that is what will get loaded fro that interval. If you set it to 0 (ie Dynamic) then the program will load enough bars to fill up a chart and then as you scroll backwards it will automatically make requests to download more data
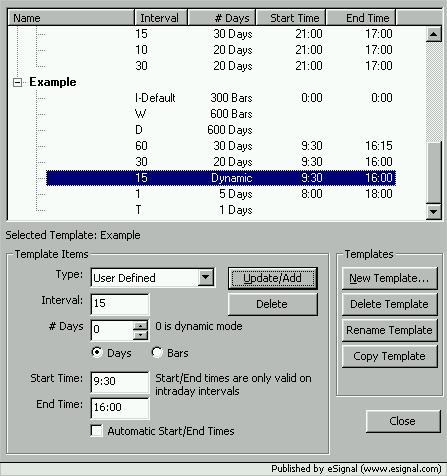
Here below is an example of a Time Template with a brief explanation
When this template is assigned to a chart the following will happen.
- if the chart is Weekly then 600 bars will be loaded
- if the chart is Daily then 600 Days will be loaded
- if the chart is 60 minutes then 30 days will be loaded with only the bars between 09:30 and 16:15 showing
- if the chart is 1 minute then 5 days will be loaded with only the bars between 08:00 and 18:00 showing- if the chart is 30 minutes then 20 days will be loaded with only the bars between 09:30 and 16:00 showing
- if the chart is a tick chart then only 1 day will be loaded
These are user defined intervals.
If the chart is on an intraday interval other than any of the ones defined in the specific template then it will use the Intraday Default which is to load 300 bars with all the bars showing (ie from 0:00 to 0:00)
If the chart instead is a 15 minute chart then it will load the bars dynamically (explanation above)
Hope this helps
Alex
 Tweet
Tweet
Comment