You should not apply the same time template to both charts. For the 1-minute chart you should use the usual "intraday" type and for the tick chart one of type "user defined" and interval "T".
I do not know if this helps in your case, but it made all the difference in case of the different Dax openings shown in the other thread.
regards
Bernd Kuerbs
-
The reason you see 00:00-24:00 on the time based chart is probably because those are the Start/End times set in the Time Template for that specific interval or as Intraday Default.
In tick based charts instead the Start/End times do not apply and show as 00:00-00:00 (you can see the same effect in the charts I posted). With tick based charts the Time Template only regulates the number of days being loaded.
AlexLeave a comment:
-
BKeurb, I have the same template applied to both charts. I don't know why it says 0-24 in one but not the other (I am using 24h). I think this might be a symptom of eSignal running into problems after operating a long time (almost a week). Perhaps eSignal can try to replicate by running their application for at least several days at a time. I know all kinds of weird things start happening when used in this way.
thanks,
atlasLeave a comment:
-
You did assign the proper time template to each chart? I do not know if this is the problem, but when the time template does not fit the chart interval, strange effects seem to be the result, see "Dax day chart problem" in this forum.Originally posted by atlas
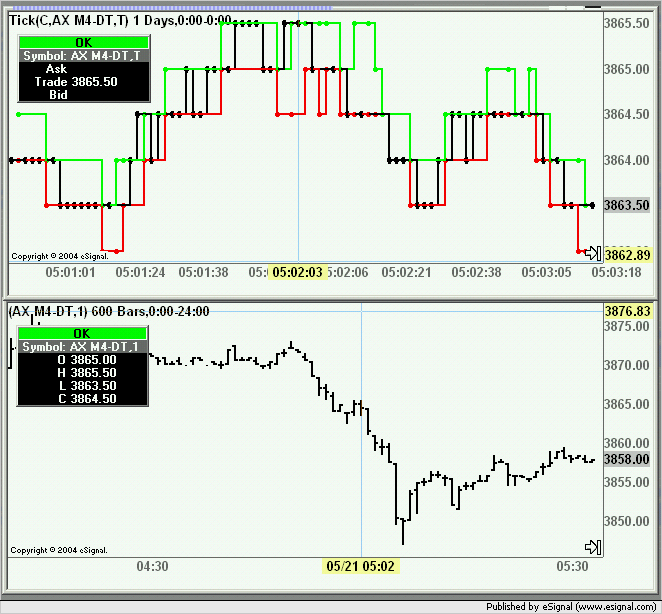
Thanks, Alex, this is what I'm seeing on my monitor. I don't know what is wrong. Notice also, the trade price is incorrect on the tick chart:
Regards
Bernd KuerbsLeave a comment:
-
Thanks, Alex, this is what I'm seeing on my monitor. I don't know what is wrong. Notice also, the trade price is incorrect on the tick chart:Attached FilesLeave a comment:
-
-
atlas
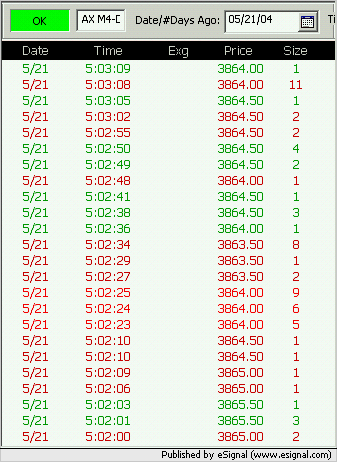
FWIW I am showing the 3865.50 high at 05:02 on Tick chart (using either T or 1T as interval) which matches the 1 minute bar and at 05:03 I have a high of 3864.50 on Tick chart which also matches the 1 minute bar.
Time & Sales match also.
Alex
Leave a comment:
-
Discrepancy in Advanced chart
Just want to make sure it's not just me:
Open an advanced chart with DAX. Open a tick chart with DAX. Click the cursor crosshair for first chart. Change period to 1 min.
Move cursor to 05:03 EST on tick chart. The high looks like 3865.50. Look at where the cursor is on the min chart. It is stationed on 05:03, yet, the high there is only 3864.50. The 3865.50 highs occurred in 05:01 and 05:02 on the 1 minute. Is there a discrepancy of 1 min between the tick and minute charts?
-atlas
Leave a comment: