Announcement

Collapse
No announcement yet.

Data confirmation

Collapse
X
 
  • Filter
  • Time
  • Show
Clear All
new posts

  • Data confirmation

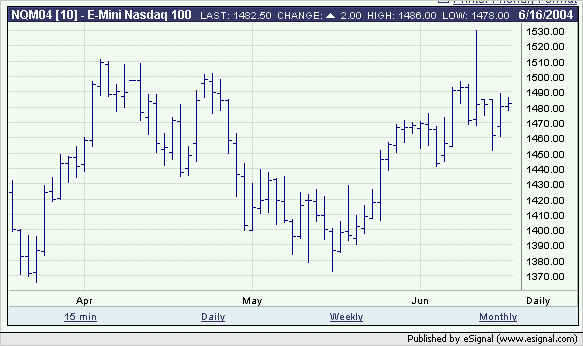
    I hope someone can help confirm if the attached chart is correct. It shows the NQ M4=2 in the last hour of trading (floor session) on Jun 10th.

    My hourly bar shows a low of approx. 1476 and a high of 1530! I was away for the last week or so and have no idea if this is correct. A friend told me it looks wrong. Could someone pls help me confirm?

    I looked thru the forum and didn't see anyone else mention this.

    Thank you!
    Anson
    Attached Files
    Last edited by Anson; 06-16-2004, 03:02 AM.

  • #2
    Anson
    It would appear to be correct.
    Here below is the daily chart of NQM4 from the CME site
    Alex

    Comment


    • #3
      Originally posted by Alexis C. Montenegro
      Anson
      It would appear to be correct.
      Here below is the daily chart of NQM4 from the CME site
      Alex

      Hi Alexis,

      Thanks for the info!
      I was wondering if CME itself could have a data problem somewhere too hehe.

      I was away during that period and now that I see the chart... that move there just looks like it was from out of this world.

      Anson

      Comment


      • #4
        Anson
        It was also strange because it was outside of the NQ allowed trading band (which I believe is at +/-40 points from the value of the full size contract)
        Anyhow by what I can see at this time CME must have revised/busted those trades as both their charts and eSignal's no longer show the spike.
        Alex

        Comment

        Working...
        X