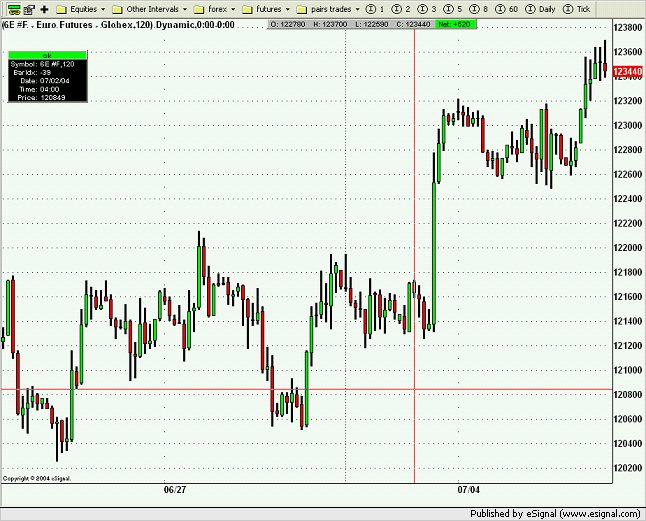
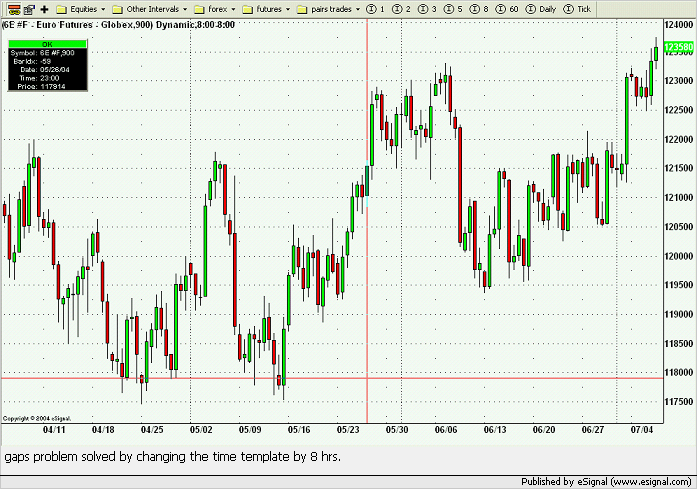
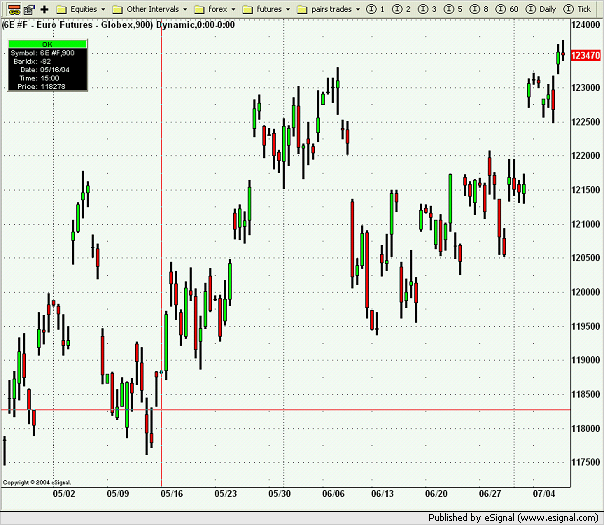
when using timeframes greater than 60 min on the intraday advanced charts i am getting a problem where there are gaps appearing ( see below image ) what is causing this and how can it be fixed , if the below image of a 900 minute chart is compared to a 120 minute chart ( above in next post ) the problem is quite clear,
Announcement
Collapse
No announcement yet.
Gaps Problem
Collapse
X
-
Hi Shogun,
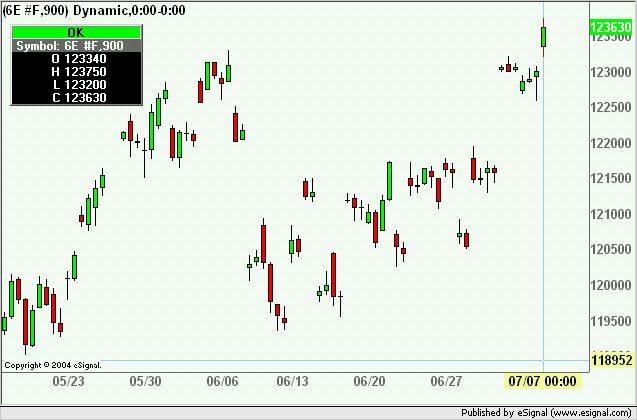
I took some screenshots of the symbol and interval you were illustrating in attempts to replicate it. Here is what I'm seeing. If you wouldn't mind PM'ing me your eSignal username, we can take a look at where you are connected and try to replicate it that way. Thanks.
Comment
-
shogun
One solution I know of is to use a Time Template where the Start/End times are the equivalent of 00:00 PST +/- the offset of the local Time Zone.
For example I am on the East Coast which means I have an offset of 3 hours respect to PST. If I use the regular 00:00-00:00 Time Template I get the following chart
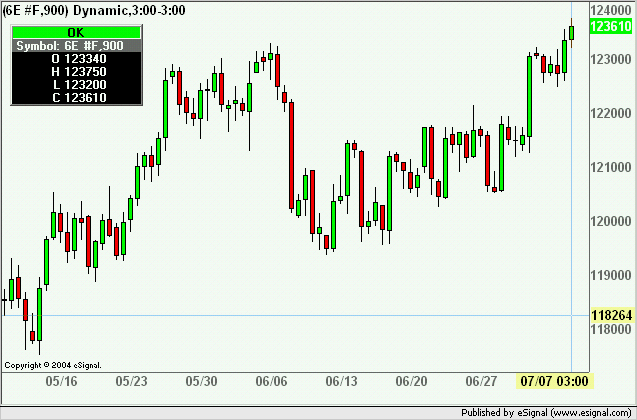
However if I use a Time Template that includes the time offset (ie 03:00-03:00) then I get the same chart as the one posted by Duane (see next image)
Hope this helps
Alex
Comment
-
by adjusting the time template the problem seems to be solved, i am in the UK so i added 8 hrs .
what causes the problem as it should not matter where you are the charts should all look the same , also for the gap to appear there must be missing data, where has it gone ?
Comment
-
just been doing a check on the PST & GMT charts on the lower time frames and they both appear identical up to the 4 hr ( 240 min ) time frame and after that they go out of sync so a 300 min chart is ok in PST time but has gaps in the GMT time frame .
Comment
Comment