There was a start on developing a Quote Window Formulas feature, during the ver 7.9 era if I recall correctly. Has that been completely abandoned (or pushed so far down the list that it may as well be)?
Since the quote window is going to be undergoing a revamp, can it be changed so that entries can't be accidentally blown away?
If the quote window has the focus, and you aren't aware of that, typing just replaces whatever might be in that cell.
In QCharts, if you type in a cell that has a symbol, the associated chart will change, but the previous contents of the cell aren't affected. If the cell was empty, the blank cell is filled in with the symbol.
Also, in QCharts, you can scroll down the list via spacebar, or up with control spacebar.
I'm not aware of a way of doing that in eSignal. You have to use the arrow keys and then hit enter (please correct me if I'm wrong).
Delayed but not abandoned. I would look for some work done in that direction with 10.2+ (Q1 of 08) as the entire quote window is getting a facelift.
Thanks.
Hi Scott
It is encouraging to hear that quote window formulas are back on the drawing board. But " I would look for some work done in that direction " doesn't sound very definite, and that is very disappointing to me.
Let me tell you why quote window formulas are so important to me. I trade US equities, of which there are thousands as you know . For a few hundred of these, I want to know when certain conditions are occuring, such as when the current intraday price has fallen to within .01% of the daily 50ema, or when the 60 minute stochastic turns back up, or the daily ADX crosses above 20, or which equity indices are trading above their pivots points, or when all my favorite stocks in a sector are trading above or below yesterdays range.
Whatever my preferred setups are, I want to know intraday when they occur, so how can eSignal tell me that?,
1. I can reset price alerts every night, but that is primitive and time consuming.
2. I can link charts to my quote list to quickly flip thru charts, but what are the chances I'm watching the right chart at the right time?
3. I could use Pages to view groups of charts, but they are slow
4. I can use EFS's to give visual and/or audible alerts, and though EFS's can do almost anything, again you have to be viewing the right chart at the right time.
But if eSignal finally developed quote list formulas (like TradeStations RadarScreen) I would know when my setups occur. Seriously, I would not care any more about all the other features that eSignal does not have that TradeStation does (workspaces, 60 minute charts ending at market close, premarket price alerts, % change Y-axis, split adjusted intraday prices, multi-thread design) if only eSignal developed quote list formulas (with the same functionality as RadarScreen).
In my opinion as an equity trader, no quote list formulas is THE biggest shortcoming of eSignal. So Scott, will this get priority in 1Q 2008? Or will another big client request push it back another year?
There is a quick solution. There was a program called StockWatchPro. Intraday setup conditions could very easily be programmed, with both visual and audible alerts when the conditions were met. They seem to have gone out of business (because of poor customer support, I suspect). But they used eSignal data, so if eSignal could buy the rights to this, maybe it could be up and running before year end. In addition, it had great scanning abilities, and as a standalone program would get around eSignals no multi-thread design limitation. I have no affiliation with them, but please PM me if you want to know more about SWP capabilties.
Otherwise, can you tell me the likelihood that the quote list formula feature will in fact be available early in 2008?
I don't have any additional information regarding timing than I already shared but your feedback is much appreciated and will be shared internally.
Just in case this opens up some new possibilities, have you seen the new QLink product we're releasing? Maybe you can accomplish some of what you need, short term, by grabbing quotes and history data and generating formulas w/in Excel.
I admit I haven't looked at QLink, largely because with the number of eSignal windows and EFS's I run my CPU is close to maxed out already. I assume I would still have to open a 2nd eSignal account to run QLink with Excel on a 2nd computer?
One of the things I liked about SWP was that it would change the background color of the cell in which a formula was entered when any of the formula conditions were met. For example, this simple formula:
would turn the cell background to green when the present daily close was above yesterdays High or to red if below yesterdays Low. If neither condition was met, it stayed grey. With this formula entered in one column of cells in my quote list, I could immediately see which of the market indices, sectors, and groupings of stocks were trading above or below yesterdays range. I've used a little bit of the logic built into Excel, but have never seen that the cell background color could be changed from within an Excel IF statement?
That above example used only two conditions. As an extreme if you wanted, within one cell you could display one of eight colors, depending on if the Last price was above or below each of the Floor Trading Pivot levels (S3, S2, S1, PP, R1, R2, R3). You could have all those conditions inside one 1/4"x1/4" cell in your quote list.
You could even mix timeframes, so the cell turned green if both the 60 minute and 15 minute stochastics were rising (or pale green if only the 60 was rising, as a 'pre-signal' to be ready when the 5 minute Stochs turned up)
SWP had all the usual studies built in, (i.e. MACD, Stochastics, RSI, ATR). Does QLink pass the latest value of a MACD study as calculated by the eSignal program to Excel, or do you have to input the MACD calculation into Excel?
I've used a little bit of the logic built into Excel, but have never seen that the cell background color could be changed from within an Excel IF statement?
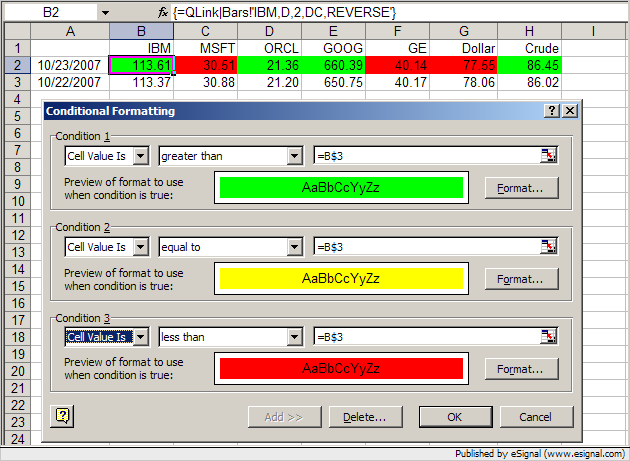
You can do that using the Conditional Formatting function in Excel which allows you to change the properties of a cell based on your conditions.
In the enclosed screenshot you can see a very basic example of Conditional Formatting. In this example I simply requested 2 days of daily Close for the symbols in the header and set the condition to color today's cell in green, yellow or red depending if the Close of today is greater, equal or less than yesterday's.
You can obviously create much more complex IF statements which could return true or false (or 1 and 0) and then based on those apply your Conditional Formatting
Alex
I did not know that Excel could do conditional formatting. Very slick.
Knowing that, I decided to follow the QLink link in Scott's previous post. I was hoping for an explanation of how this works but couldn't see one. So, some basic questions:
1. Does QLink work with eSignal data alone or do I need QCharts as well for any reason?
2. In your example, daily closing values were used. Could you have compared the closes of the last two 15 min bars for IBM? Does QLink pass thru to Excel only basic raw data (OHLC and Volume) or can it pass thru study results? For example could line 2 in your Excel example be the latest real time 15 minute stochastic %K value and row 3 be the %K value at the close of the previous 15 minute bar? Or would QLink only pass thru the raw data and the stochastics calculation would need to be done in Excel?
3. Can QLink pass data thru to my 2nd computer or would I have to run eSignal, QLink and Excel all on the same computer?
Maybe a Help file appears that answers the above questions if I download and install QLink? But I was relucant to install a program until I know what it does.
shaeffer
1. Yes it works with eSignal. You can find more details on QLink in this announcement of the official release of QLink
2. Yes I could have compared the closes of the last two 15 minute bars (or those of any other interval).
QLink will retrieve real time and historical data for OHLCV and a snapshot of several data fields similar to those available in the Quote Window. It does not retrieve studies so you would need to calculate those in Excel
3. You would have to run them on the same computer unless you have multiple subscriptions to eSignal. For more information on running eSignal on multiple computers see this article in the eSignal KnowledgeBase
Alex
Delayed but not abandoned. I would look for some work done in that direction with 10.2+ (Q1 of 08) as the entire quote window is getting a facelift.
Thanks.
In all the ways eSignal has fallen behind TradeStation in the last three years, abandoning the development of quote list formulas is my biggest disappointment.
EFS's in eSignal do a fabulous job of flagging intraday setups, but the major problem with that is an EFS has to run in a chart, and how many charts and EFS's can a person run? (less it seems in 10.x than 8.0). And my gut feel is that a lot of the complications and CPU useage of EFS's is because of the graphics interface.
So why not get rid of the need to link trade setup calculations to a chart????? Instead, do the calculations in a formula in a quote list column. Then the only graphic load is a change of background color in the quote list when the setup condition occurs.
Then a trader could watch 30 stocks in one 2"x8" quote list (in 1/10th of one monitor) as opposed to having to run 30 charts with EFS's in 4+ monitors with the related greatly increased CPU loading.
I've seen a preliminary example of what a quote list formula would look like in eSignal (back when it was under development) and it is soooo much simpler than an EFS.
Is eSignal's Dashboard the reason quote list formulas have been put on the back burner?
If you mean things like Price > $20, 90 day Volume > 600,000, Nasdaq stocks only, earnings this Qtr > last Qtr, then there are lots of end-of-day online sources to filter the universe of stocks down to a manageable watchlist with those criteria. I don't think of that kind of filtering as something eSignal should get into.
But if you mean intraday scanning for stocks that meet certain criteria (i.e. filtering out stocks that don't), then I agree with you completely. For example, one intraday scan I use to find pullbacks on a list of rallying stocks (determined and updated the night before) is a 60 minute stochastic dip reversal. I've had to resort to other software that will do that for me.
Ultimately eSignal should have that intraday scanning capability. But to begin with, I suspect eSignal would start with simple formulas in a fixed list of stocks in a quote list. Simple formulas would include:
- Last above or below first 30 minute range
- Last > Yesterdays High (or < Yesterdays Low)
- Last >/< High/Low two days ago
- Last >/< High/Low of last 5 day range
- 5 minute hammer near low-of-day
- last near daily 200sma
- 15 minute stochastic rising (or falling)
- Last > highs of previous three 5 minute bars
Then once that was perfected for a fixed list of stocks, the ability to scan a larger group of stocks and display only those that met specified criteria would be the next step. Tradestation (RadarScreen) has had both the static list formulas and scanning ability for years.
Originally posted by shaeffer
Is eSignal's Dashboard the reason quote list formulas have been put on the back burner?
It's possible that the Dashboard window will be utilized to handle EFS scripts (since it already does this in some ways) and if so, then the recent improvements made to the Dashboard will only further enhance it's functionality. Those include letting the user determine the time frame for each dial, customizing the # of dials, allowing different studies in different Dashboards, enabling time templates and linking to the scanner and a dynamic text file.
So, to answer your question, no I don't think the dashboard work has pushed development backwards. If anything, all these improvements get us closer towards eventually having a powerful display tool for EFS scripts.
 Tweet
Tweet
Comment