 Tweet
Tweet
I would like to plot the real time change in perecent between ES-NQ.
-
-
Re: PLOT the Daily Percent change spread
bsesen
You can do that by charting the spread and using the DailyPercentComp.efs which can be found here
Alex
Originally posted by bsesen
I would like to plot the real time change in perecent between ES-NQ. -
PLOT the Daily Percent change spread
Thanks Alexis C. Montenegro but that is not what I am looking for
I am trying to plot only the Daily Percent difference as the main chart = ( Daily Percent change S&P - Daily Percent change NQ )
I don't want to plot the S&P chart and the Comparison as an sub chart.Comment
-
Re: PLOT the Daily Percent change spread
bsesen
Assuming I understood you correctly what you are trying to do is not currently possible.
Having said that you may still be able to accomplish something similar by using the script I indicated in my previous message.
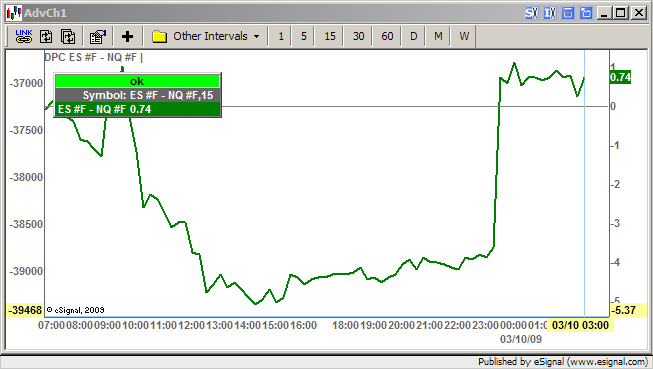
What you would do is chart the spread ES #F - NQ #F and run the efs which will calculate the daily precent change of that spread then from Edit Studies overlay the resulting plot on the main window and hide the price bars of the spread (see enclosed image)
Alex
Originally posted by bsesen
Thanks Alexis C. Montenegro but that is not what I am looking for
I am trying to plot only the Daily Percent difference as the main chart = ( Daily Percent change S&P - Daily Percent change NQ )
I don't want to plot the S&P chart and the Comparison as an sub chart.Comment
-
Hi Alexis,
I see that you have a great knowlage in ploting change Percent Spreads
I am trying to plot the Daily Percent change spread between ES-NQ, in candle form and then add EMA to it
Can one plot from excle
Enclosed below are some screenshots showing the percent change values of some spreads as returned by the script and for comparison as calculated in Excel [using DDE]Comment
-
Thanks Alexis
I am trying to plot the Daily Percent change spread between ES-NQ, in candle form and then add EMA and other tools to it to study.Comment
-
Hi Alexis,
Thanks I tried but the scale is not right. as you can see in the attachment
the Percent change in ES is 1.78 & NQ is 1.41 so the diff should be 0.37 but in the chart you see 0.87.Comment
-
bsesen
See the solution I posted in this thread on a similar topic
Alex
Originally posted by bsesen
Hi Alexis,
Thanks I tried but the scale is not right. as you can see in the attachment
the Percent change in ES is 1.78 & NQ is 1.41 so the diff should be 0.37 but in the chart you see 0.87.Comment
Comment