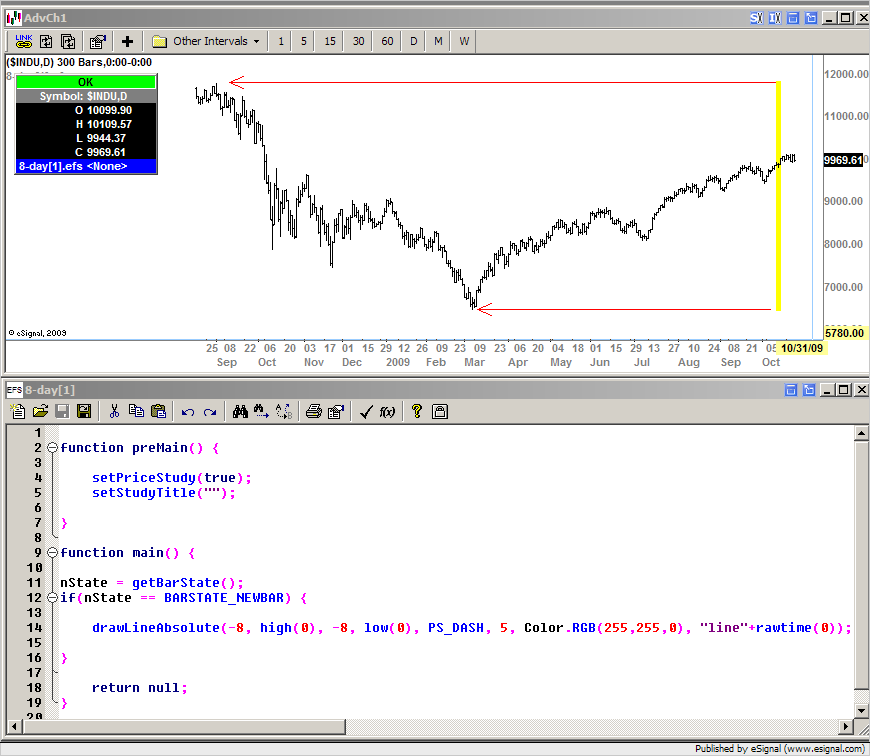
I am running a very basic formula that is causing my CPU% to increase substantially.
I have attached the formula: 8-day.efs.
I am a power user with multiple screens and multiple charts. I run with a page file with 8 open active charts, all configured the same. My system is one year old: Intel Core 2 Quad Core - 2.83Ghz (12MB Cache), Intel 1333Mhz FSB Quad Core Motherboard, 4GB Low Latency RAM, 74GB 10,000 rpm SATA Western Digital hard drive, Windows XP Pro with SP3.
I monitored the CPU percentage for 2 hours during active trading. The first hour without the 8-day formula showed the CPU% constant between 0 and 3% with occasional spikes to 6-7%. The second hour was with the 8-day formula running on all 8 charts and the CPU% increased to 15-20% consistently with occasional spikes to 30%.
On each of the 8 charts, the active studies are 5-SMA, 8-SMA, 200-SMA, Bollinger Bands, Stochastics, and Volume.
The addition of the formula is the ONLY change I made. This is such a small and basic formula. Why does it cause such a drastic increase in resources required? I even tried to optimize it by using barstate logic to only process on a newbar.
Thank you for your assistance.

Comment