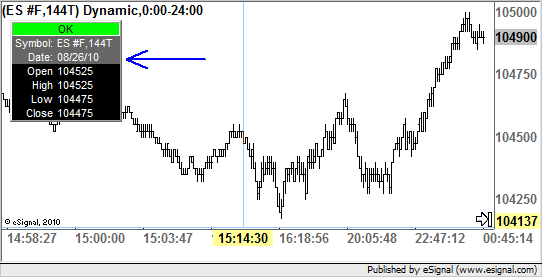
Hello All,
Learned using esignal very quickly but still have few questions. And any advice will be highly appreciated.
(on 144 tick chart of an equity, for example)
1) How I get dates on X axis? All I see is time on X axis and it is getting difficult to find out which day chart I am looking at?
2) I do not want to see pre market & after market bars on my chart. How to remove / disable them?
3) How to enable such that the price always be at the center of the chart? Right now I am using the mouse to drag the chart up or down so that the current price bar says at the center.
The scaling options are good, but does not center the price.
4) When I do back testing, despite checking the long & short options, I see only longs in the summary / results page. For example, I was back testing the ATR Chandelier exit indicator and i am facing this.
Thanks much.
Sam

Comment