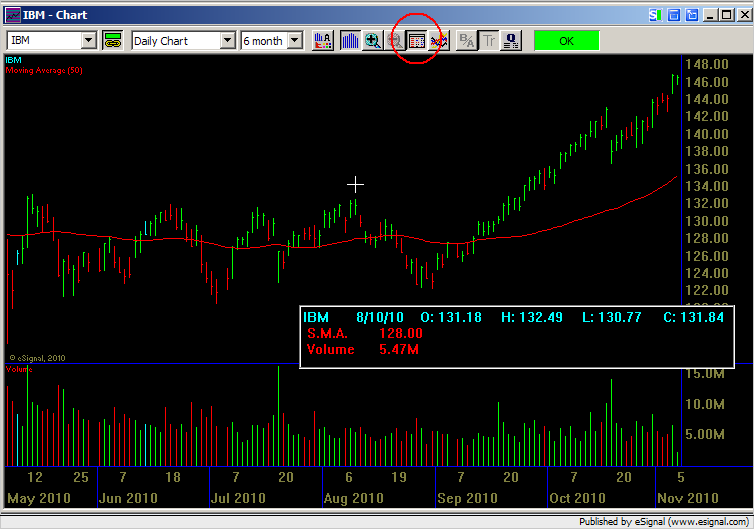
With 24-hour markets that operate without reference to time and place, the volume distribution ("volume at price") is a critical data point. Steidlmayer warned of this sea change nearly 20 years ago ("Change is necessary, and it lies in the acceptance of the timelessness of distribution as it relates to market organization.")
Market Profile is one solution, but data organization within the profile deems "volume" as a function of time and price (with the TPO method). This is rather eviident when viewing a continuous 24-hour profile, where TPOs accumulate during slow market hours, yet volume does not. The "volume at price" distribution presents a more accurate depiction of true capital flow.
With that being said, I would propose that eSignal expand on this tool within their software package. A few of the issues/questions/suggestions I have with the current "Price/Volume" chart within the standard charting package are as follows:
1. Is true "volume at price" represented, or is it simply "tick volume?"
2. Time parameters currently do not allow a trader to look at volume over multiple days. It does not allow a lookback even over a typical 24-hour GLOBEX session (18:00EST to 17:00EST).
3. Highlighting "last price" within the distribution would also be helpful tool.
4. Color changes based on time within the distribution. For example, volume closer to current time has a different shade/color than volume occurring further back.
Please respond. I hope that this creates a discussion and awareness about this form of market analysis.

Comment