 Tweet
Tweet
I have added a RSI to my list of stocks for the new v 11 watchlist and the value given in the watchlist is incorrect. It doesnt match up with what I have in v10.6 and the settings are for a 60 min chart with a RSI period of 14.
-
-
Re: EFS values in v11 watchlist are incorrect
burrjed
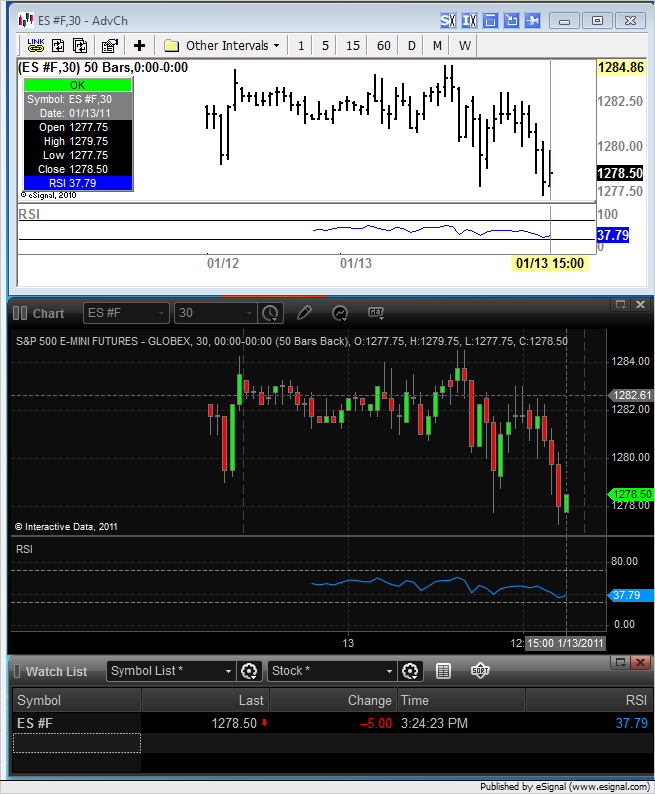
From what I am seeing at my end it appears to be returning the same results of 10.6 when the latter is based on the same number of bars used in the Watch List which I believe is currently hard coded at 50 [as I understand it this will change in a future release]
Keep in mind that the values returned by the RSI are affected by the number of historical bars as it uses a smoothing algorithm that is iterative ie it depends on its previous values.
Anyhow you can easily verify this by creating a Chart with a Time Template set to load 50 bars of data and then run the same RSI study on that and you should see that the values will match those in the Watch List [see first enclosed screenshot]
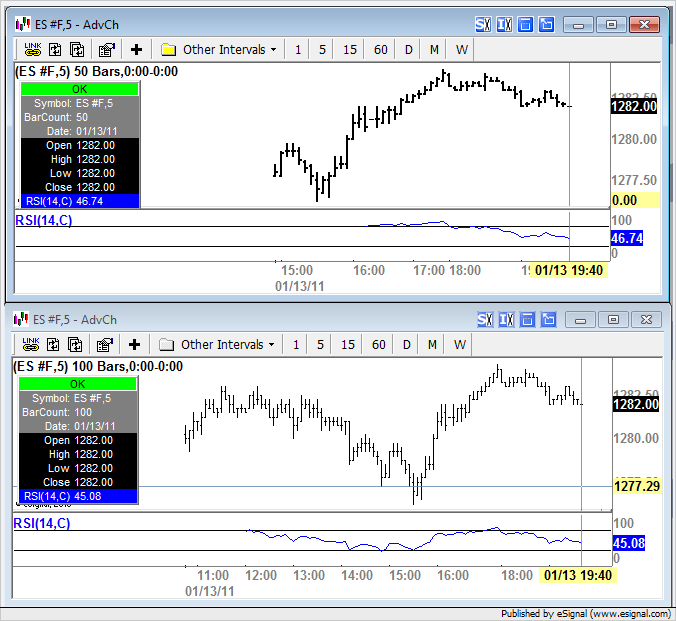
To verify instead how the number of bars affects the results of the RSI also set up a second chart with a 100 bars loaded and run the same RSI study and you should see that its values will be different from those of the chart with 50 bars [see second enclosed screenshot]
Alex
Originally posted by burrjed
I have added a RSI to my list of stocks for the new v 11 watchlist and the value given in the watchlist is incorrect. It doesnt match up with what I have in v10.6 and the settings are for a 60 min chart with a RSI period of 14. -
Thanks Alexis, I wasnt aware that v11 was hard coded for 50 bars so that would explain the issue. Thanks again for your help...Comment
-
burrjed
You are welcome
Alex
Originally posted by burrjed
Thanks Alexis, I wasnt aware that v11 was hard coded for 50 bars so that would explain the issue. Thanks again for your help...Comment
Comment