-
-
Was that trendline drawn on a larger time-frame (Weekly) and then shift when moving down to a smaller time-frame (60-min.)?
This effect can occur because the anchor point of the line when drawn on a Weekly interval is the Monday on the week it was drawn. When you move down to a 60-minute the low point of the week that was the anchor could be in the middle of the week... a different spot than where you drew it on the Weekly interval.Regards,
Jay F.
Product Manager
_____________________________________
Have a suggestion to improve our products?
Click Support --> Request a Feature in eSignal 11 -
Not JayF.Originally posted by JayF
Was that trendline drawn on a larger time-frame (Weekly) and then shift when moving down to a smaller time-frame (60-min.)?
I drew trend lines in this time frameComment
-
>Jay
This may or may not be related to brigitrader's point.
When you plot a trendline on a daily chart, change the interval to say 5 min. and then go back to the daily chart, the trendline, not always - but often, changes its position. The same problem existed last year but I don't remember if it was once fixed or not.
A few minutes ago I was easily able to do it with $HSI-HKG and JGB10 1!-TPX as shown in the attached. But I can't do it again at the moment. Comes and goes!.
jayAttached FilesComment
-
-
I have the same problem detailed in brigitrader's post.
The displacement of any text or trendlines placed on a chart always occurs when the compression is changed from time, say 5-min to tick, eg 200-tick. All drawn items are displaced to the left. The vertical alignment (price) remains at correct level.
The displacement does not occur when changing compression from tick to time.Last edited by coolo; 03-15-2011, 02:25 PM.cooloComment
-
coolo
As Jay Frank explained in his post the reason for what you are seeing could be due to differences in the timestamps between intervals. As an example of this see the following image
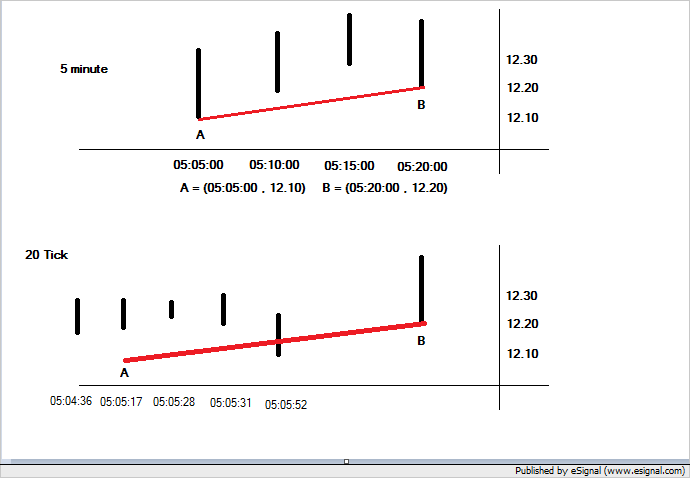
In the top part is a replica of a 5minute chart. The trend line is drawn between points A and B. The coordinates of each of these two points are the timestamp (x) and the price (y).
So the coordinate for point A is 05:05:00 , 12.10 (note that I left out the day)
In the bottom part of the image is a replica of the 20tick interval. As you can see there is no bar that has a timestamp that is exactly the same as that of the 5 minute chart so the program looks for the first bar that has the same day, hour and minute portion of the timestamp and uses that as the x coordinate (BTW the reason eSignal uses the first bar is that its timestamps reference the beginning of an interval. Other programs that instead reference the end of the interval as the timestamp will use the last bar).
Anyhow in the example this is the bar at 05:05:17 so the program draws the trend line using that bar as the x coordinate and then uses the price ie 12:10 as the y coordinate.
However because the Low for that 5 minute bar did not happen exactly on that 20tick bar but occurred instead at the 05:05:52 bar [and for that matter it could have occurred at any of the other 20tick bar contained within that 5 minute time frame] the trend line appears displaced (the same will happen for point B)
Lastly this can happen also using any other interval and FWIW occurs also in every other charting application I have for the same reasons [see for example the animation enclosed below captured using MultiCharts]
Alex
Originally posted by coolo
I have the same problem detailed in brigitrader's post.
The displacement of any text or trendlines placed on a chart always occurs when the compression is changed from time, say 5-min to tick, eg 200-tick. All drawn items are displaced to the left. The vertical alignment (price) remains at correct level.
The displacement does not occur when changing compression from tick to time.Comment
-
I'm now having problems with tick charts. On the attached chart I have simply changed compression from 5-tick to 13-tick & to 55-tick. I have not used a time based compression (minutes)
I can understand that your detailed explanation could also apply to tick charts as well since a 5-tick bar would have it's opening minute at a different time to say, a 55-tick bar.
However, the attached chart has the drawn items displaced by days to the left so it appears that the database for the X co-ordinate (time) for each end-point of the trendline is not being referenced correctly when a compression change is applied.
It also seems that the "day" & "hour" component for the X co-ordinate has a multiplier factor applied as the greater the distance the co-ordinate is from the hard right edge, the further to the left the displaced co-ordinate appears.Attached FilescooloComment
-
-
As a follow-up to my last post, I suspect that the original co-ordinate data is being over-written when a new compression is requested.
The trendlines were originally placed on a 13-tick chart. From memory, I then viewed the chart as 5-tick & all drawn items were in their correct position. When next viewed as a 55-tick chart the drawn data was displaced & remained displaced when viewed again as a 5-tick or 13-tick chart.
When viewed again as a 55-tick chart, the displacement was shifted even further to the left. This to me indicates that the co-ordinate data is being over-written with each compression & that new co-ordinate data is then used to further displace the drawn items when a higher compression is requested. When viewed in the same compression that the items were originally drawn in, the displacement remains which means that the co-ordinate data has been changed.
................just my 2 cents worth.cooloComment
-
IT GETS WORSE
The drawn items are displacing both horizontally & vertically without a change of compression.
The only change made to the chart is to zoom in & out using the same compression & the anchor points for both text & trendlines change.
Is this problem being addressed?? I have had no acknowledgement from support that this problem is being investigated
It is impossible to use V11 until this is rectified.cooloComment
 Tweet
Tweet

Comment