 Tweet
Tweet
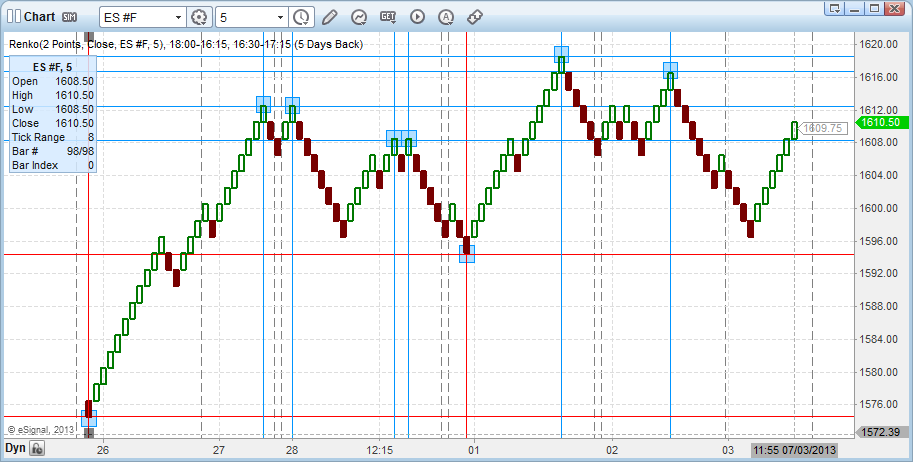
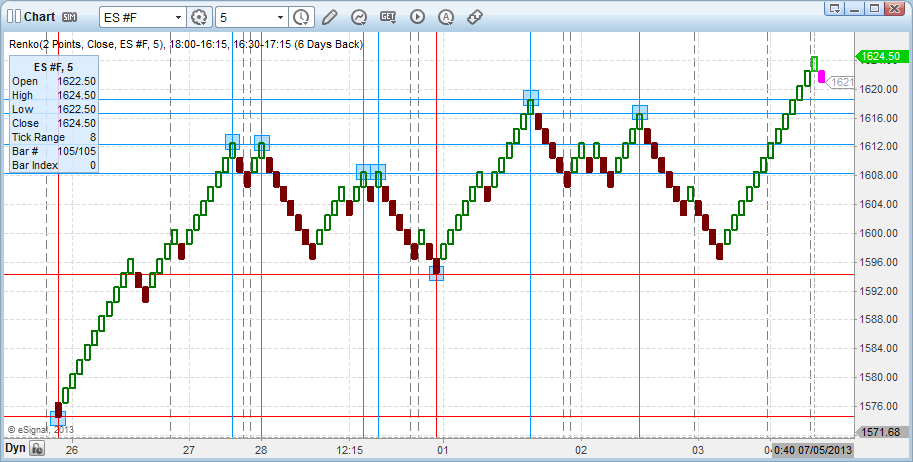
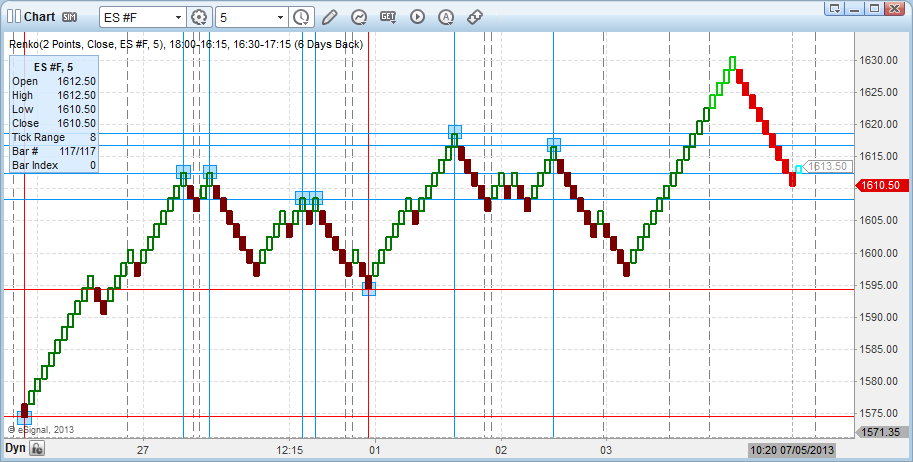
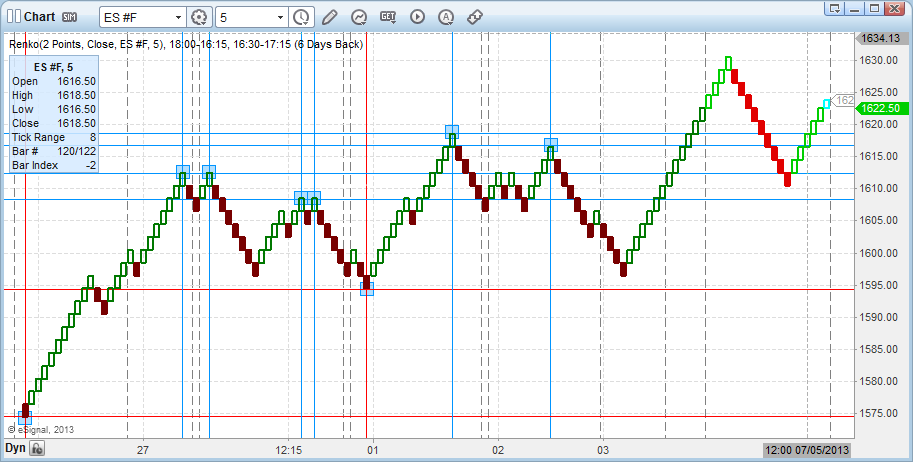
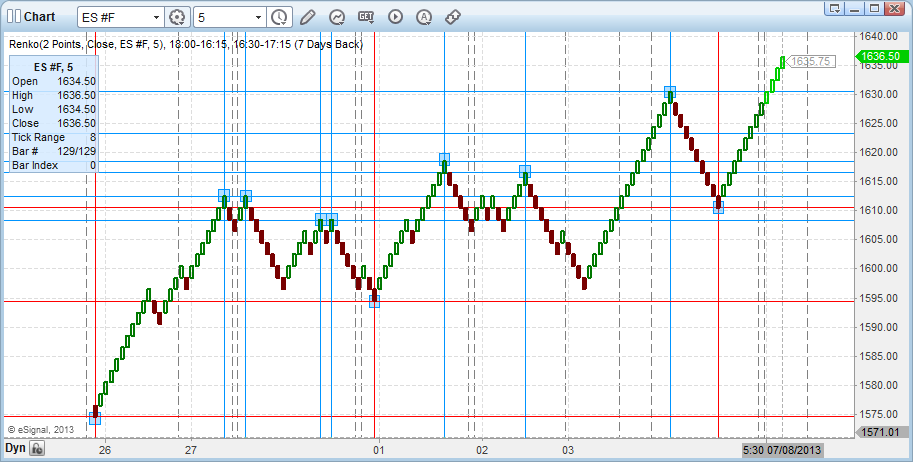
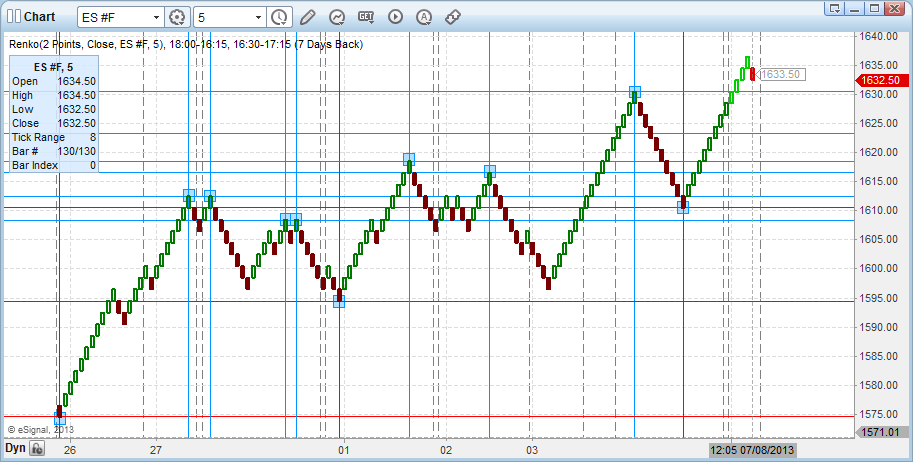
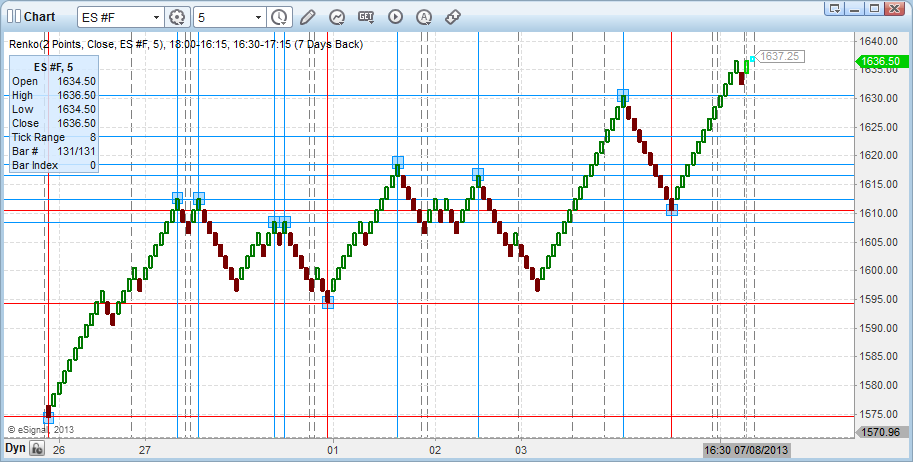
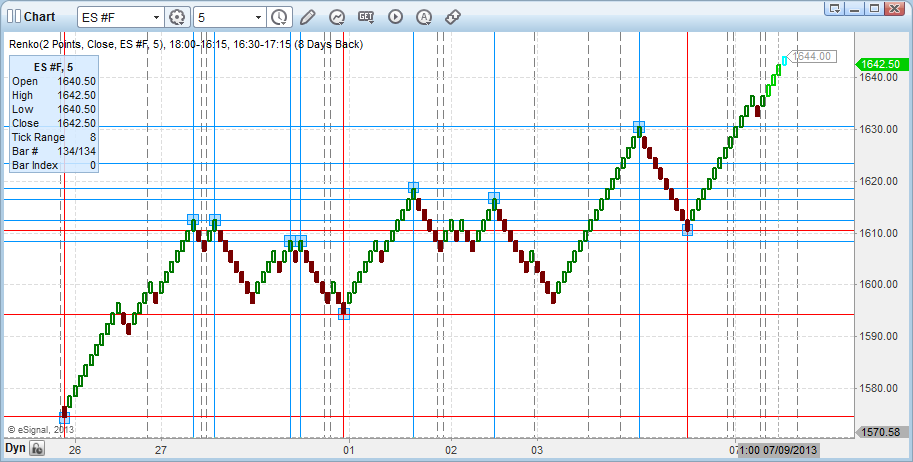
I use Renko charts. Every time I close down and reopen my esignal, the chart forms differently. And if I do it on 2 different computers, it forms differently on each computer. I think this is because it loads from the present moment and backwards. I would like to have the same chart every time I look, and continue with the same chart from day to day. Is there a way to set the chart to load from a specific moment and forward? I think that would solve my dillema. Thanks.
Also, when I overlay another Renko with a different setting (i.e. a 1 point over a 2 point), they don't begin at the same moment or price. I would like to fix that too.thanks again.
Also, when I overlay another Renko with a different setting (i.e. a 1 point over a 2 point), they don't begin at the same moment or price. I would like to fix that too.thanks again.
Comment