I have two questions.
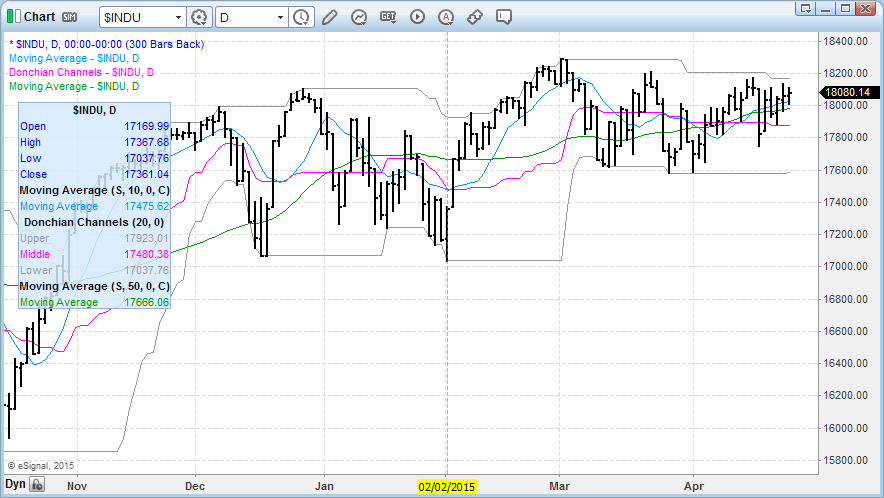
1) Is there any way of removing the price data from: moving averages, any study applied to the chart, that is displayed on the right side of my chart? I really don't want my price axis cluttered with prices from all the studies I've added to my charts or from the moving averages I've added.
I'm coming from version 10.6 and removing this data was a feature in that version. I hope it is in this version also but I can't find out how to remove it.
2) In the Data window displayed in the upper left of the chart, I'd like to get the: Open, High, Low, and Close price listed in that Data Window so when my cursor is hovered over a particular price bar, I can see, from a glance, what the Open price was, what the High price of that bar was, what the Low price was, and what it closed at.
According to the knowledge base article 4691, Chart Window Basics, it shows that this option is available. If you scroll down to where the info on "Data Window" starts, and then scroll down to the 2nd picture where all the different colored lines are that point to different areas of the Data Window, you'll see a Data Window with "Dell, M" in the title and you can see the "Open, High, Low, Close" listed there.
And if you scroll down to the next picture that has in the Title Bar: Edit Chart, the 2 sentences above that picture are: To change the color of the Open, High, Low, and Close text in the Data Window, right-click in chart and select Edit Chart. Highlight the chart symbol and left-click on the color control button next to Text in Data Window and select the desired color from the color palette.
This option for the Data Window was also available in version 10.6, I hope I haven't lost that in version 12!
Can I get some help/suggestions in regards to the questions I've asked here?
Thanks,
Steve

Comment