Announcement

Collapse
No announcement yet.

WARNING! URGENT! Chart problem

Collapse
X
 
  • Filter
  • Time
  • Show
Clear All
new posts

  • WARNING! URGENT! Chart problem

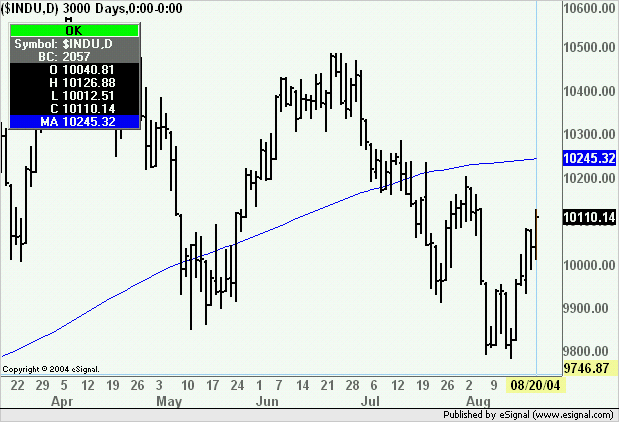
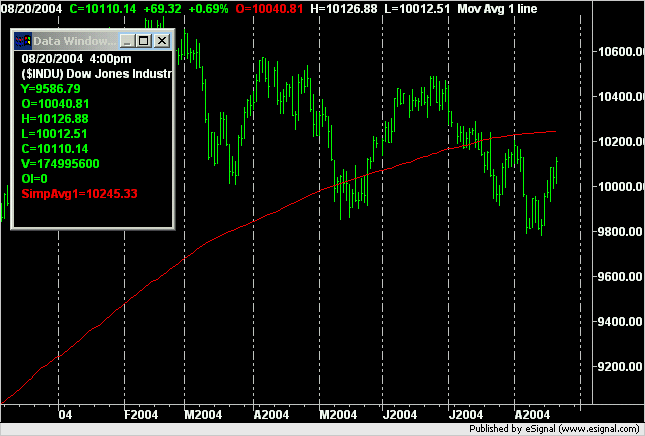
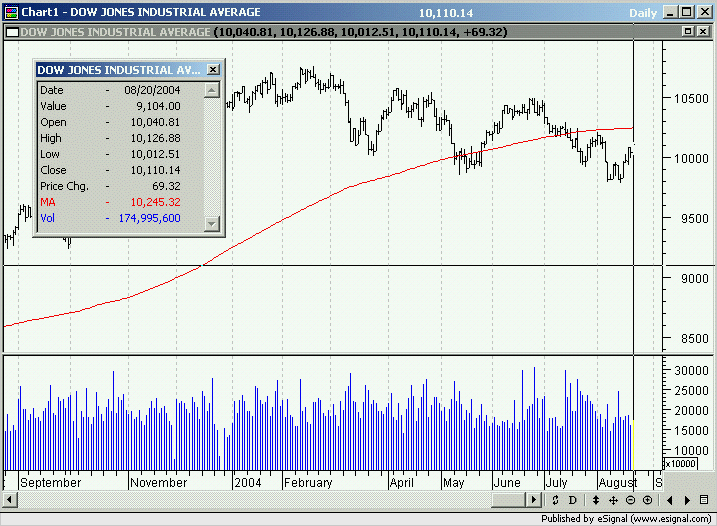
    I'm not sure if anyone else has realized it but the moving averages (I only checked the 200 day) on longer term charts
    ARE WRONG!!!!


    When using a 3 year chart and getting the 200 day MA it's incorrect!!! You can only get the correct 200 day ma on shorter term charts.

    Just thought i'd let you know.

  • #2
    cdalrym,

    Do you have an example of what is incorrect? Are you manually calculating the 200 MA? If so, can you attach the data being used? We also need to know:

    - What symbol(s) are using?
    - What version of eSignal you are running?
    - What are your exact settings for the MA and the chart? (i.e. Advanced Chart, 200 SMA Close, Time Template 780 days)
    Regards,
    Jay F.
    Product Manager
    _____________________________________
    Have a suggestion to improve our products?
    Click Support --> Request a Feature in eSignal 11

    Comment


    • #3
      FWIW I ran a 200 sma on over 2000 bars (equivalent to approximately 10 years) of $INDU on eSignal, TS2k and Metastock Pro and the charts for each can be seen below.
      Alex


      Comment


      • #4
        Sorry for the late reply.

        Take a look at a one year on HUM and then a 3 year. It gives 2 different calcs for the 200 day MA.

        The rep told me on the daily 3 year chart it's not a 200 day MA but a 200 week MA for soem reason.

        Comment


        • #5
          cdalrym
          The two charts below are for 250 and 750 daily bars with the same 200 period SMA. They appear to be identical at my end.
          Alex


          Comment

          Working...
          X