Announcement

Collapse
No announcement yet.

Daily Moving Averages in intraday charts?

Collapse
X
 
  • Filter
  • Time
  • Show
Clear All
new posts

  • Daily Moving Averages in intraday charts?

    Hello,

    is it possible to have the 10 day moving average charted in an intraday-chart such as 3 minutes ES?

    (Or at least to have the 10 day moving average stated somewhere on the screen so that it is easy to see at all times?)

    Is there an EFS somewhere that manages this?

    regards
  • #2
    Dr Zoom
    See this post by JasonK
    Alex

    Comment


    • #3
      Thank you Alexis! You are quick! :-)

      Comment


      • #4
        Alexis - do you know if there is an EFS that plots the EMA instead of the SMA?

        This thing was discussed in the link that you provided, but there was no solution to that question at that time.

        regards

        Comment


        • #5
          Dr Zoom
          Not that I can remember seeing.
          Alex

          Comment


          • #6
            Ok Alexis. Another question. In the help section I found the following information regarding 3 line breaks:

            "3 Line Break

            Just right-click and select Chart Type, then Three -Line Break to display a Three-Line Break chart. A Three-Line Break chart displays new lines if the close of the period moves outside of the period of the previous block of trading. If not, then no lines are drawn.
            The first line is drawn when the prices are greater, lower, or the same as the opening price. If prices exceed the prior high (low) price a new line is drawn if current prices are within the prior high or low, no new line is drawn.

            When using a 3 Line Break chart, prices must exceed the prior three high or low lines to indicate a reversal".

            BUT i cannot seem to be able to do this in Esignal. The "only" chart types that I can choose are Bar, line, candles, PF, Kagi, Renko and point break.

            Do you know if it is possible to get a 3 line break chart or if there is some EFS that makes this possible?

            Comment


            • #7
              Dr Zoom
              Point Break charts are the same as 3 Line Break. In fact if you change the chart to Point Break and then go into Edit Studies you will see that the Chart Type is 3PB/3LB
              Alex

              Comment


              • #8
                ok - thanks!

                Comment


                • #9
                  Dr Zoom
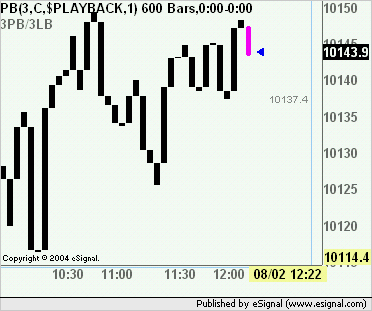
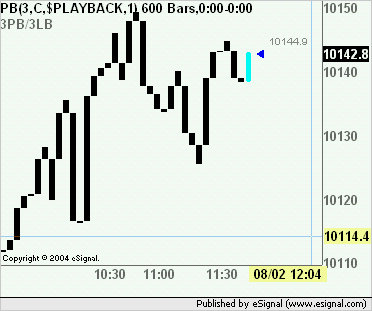
                  If you are using 3PB/3LB charts you may want to try the attached efs which will show you the projected reversal level. In the following images you can see an example of the efs at work.
                  Note that if you change the Point Break Amount for the chart you also need to change it in the efs using Edit Studies
                  Alex


                  Attached Files

                  Comment

                  Working...
                  X