 Tweet
Tweet
Hi,
I found what I believe to be a glitch with the way version 7.7 (build 679) processes Volume bars.
I use volume charts in my mix of analysis tools. I was watching a 500V ES #F chart today and noted some unusual behavior I had not previously noticed.
I noticed with version 7.7, the volume chart bars are now exactly 500V on the chart when loading the chart up. That is something I do not care for personally, I liked it before version 7.7 when the Volume charts were either at or greater than 500.
I used this as an indicator of sorts that indicated if the last trade (depending on how far over 500 it went) was a large one, giving you a flavor for the market. This was true for Real Time (R/T), Historical and $Playback.
With 7.7, this is no longer the case. Every bar is now 500V as the historical bars load. Now, here is the glitch. However, now in R/T, it appears if the last trade of the bar would exceed 500V, the bar is ended at the lower number. For example, if the forming bar was at 380V and a trade came in at 150V, the bar would end at 380V and the next bar would start. I have attached a screen print to demonstrate my point.
My first request is that you return how the volume bars are processed to the previous methodology. Making them always 500V eliminates, in my mind, an available technical indicator.
If that cannot be done, could you please make it such that the historical bars and the R/T bars are processed consistently?
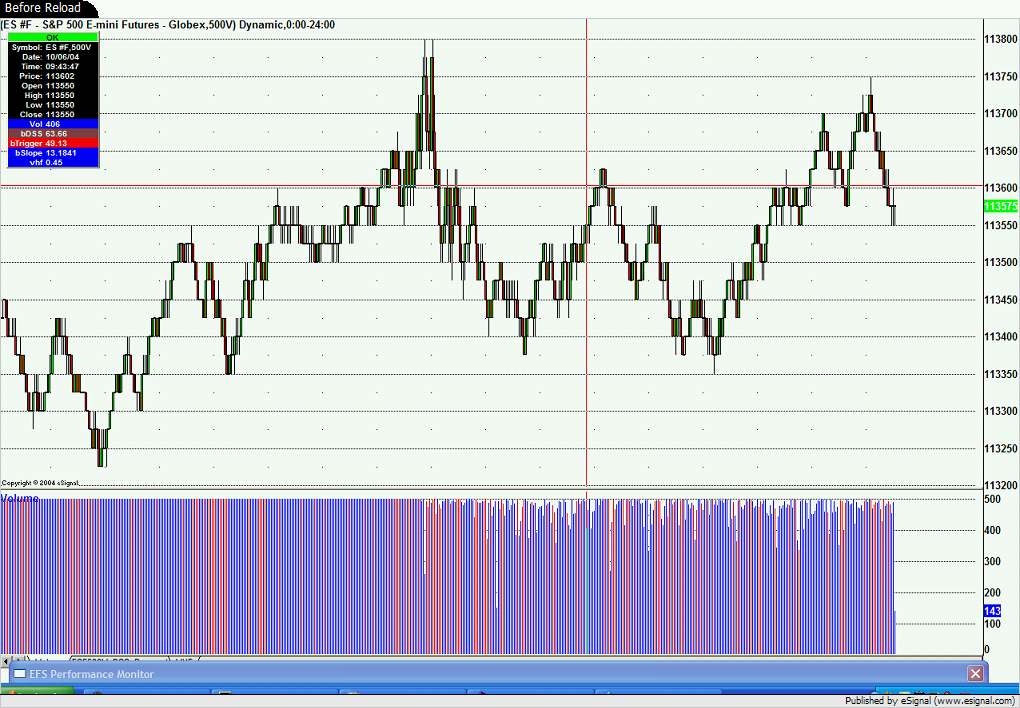
Here is the chart. You will notice that the historical volume was consistently at 500V, however, you can see where the chart transitioned to R/T Data, where the bars are no longer consistently reaching the 500V level (some were below 200V). <BTW> I loaded another chart, and the R/T behavior repeated itself starting from that point forward.
I found what I believe to be a glitch with the way version 7.7 (build 679) processes Volume bars.
I use volume charts in my mix of analysis tools. I was watching a 500V ES #F chart today and noted some unusual behavior I had not previously noticed.
I noticed with version 7.7, the volume chart bars are now exactly 500V on the chart when loading the chart up. That is something I do not care for personally, I liked it before version 7.7 when the Volume charts were either at or greater than 500.
I used this as an indicator of sorts that indicated if the last trade (depending on how far over 500 it went) was a large one, giving you a flavor for the market. This was true for Real Time (R/T), Historical and $Playback.
With 7.7, this is no longer the case. Every bar is now 500V as the historical bars load. Now, here is the glitch. However, now in R/T, it appears if the last trade of the bar would exceed 500V, the bar is ended at the lower number. For example, if the forming bar was at 380V and a trade came in at 150V, the bar would end at 380V and the next bar would start. I have attached a screen print to demonstrate my point.
My first request is that you return how the volume bars are processed to the previous methodology. Making them always 500V eliminates, in my mind, an available technical indicator.
If that cannot be done, could you please make it such that the historical bars and the R/T bars are processed consistently?
Here is the chart. You will notice that the historical volume was consistently at 500V, however, you can see where the chart transitioned to R/T Data, where the bars are no longer consistently reaching the 500V level (some were below 200V). <BTW> I loaded another chart, and the R/T behavior repeated itself starting from that point forward.
Comment