 Tweet
Tweet
In the efs library, all studies appear to plot results on the last bar. How do you plot a centered moving average on the central data point without impacting an end centered average?
-
-
-
CMA
Can I merge the end centered moving average from the library into the supplied centered moving average program so I can plot both on the same chart at the same time without the centered moving average impacting the end centered?
Thanks
AlanComment
-
Alan
Yes you can and I have written an efs that does that. Run a Search using alexis as the User Name (set it to Match partial name) and negative AND offset as the Keywords and you should find it.
Having said that unless you have a specific need to plot the moving averages using an efs you can achieve the same results with the moving averages in Basic Studies.
AlexComment
-
Moving Averages
Where and how do I conduct this search?
Thanks,
AlanComment
-
Alan
Click on the Search link in the Bulletin Board menu (top image).
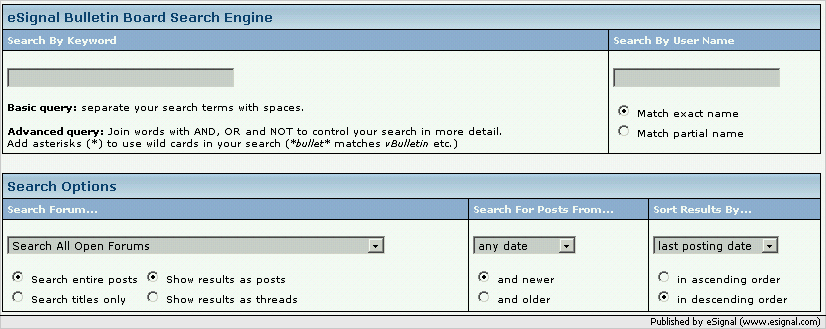
This will take you to the Search page (bottom image) where you can set your criteria
Alex
Comment
-
Alex,
Your suggestions have been very helpfull !
1) I located your basicMAx2 2 moving average file and have run it. Are there any program limits for adding additional MA into this program other than machine speed? I would follow your naming nominclature and just replicate additional MA's.
2) Are there examples for doing calculations using the results of the moving averages and selecting values from different bars? Assume each MA was assigned to an array ( I would need an example if this is possable ):
var1 = MA1(2)*MA2(4) where the results from the 1st MA is selected from the second value corresponding to the second most recent bar on the screen ( end centered moving average ) and the second value is selacted from the fourth value from the right.
I do not want to return the MA reults, only the result var1 as a line on the chart. If there are several examples I could cut and past from it would speed up my program development time.
Your help is greatly appreciated.
Best Regards,
AlanComment
-
Alan
1. Not that I am aware of
2. The efs I suggested earlier should include an example of how to retrieve past values of the moving averages since it uses those in the conditions to paint the bars.
Regardless if you are using the builtin studies you can access the historical values directly without the need of an array. For example to retrieve the value of 2 bars back of the average you would use vMA1.getValue(MAStudy.MA,-2). So in your case you would write the following
var var1 = vMA1.getValue(MAStudy.MA,-2)*vMA2(getValue(MAStudy.MA,-4)
You could also assign those specific values to a variable so as to make the code more efficient if you are using those variables throughout the formula
var avg1_2 = vMA1.getValue(MAStudy.MA,-2);
var avg2_4 = vMA2.getValue(MAStudy.MA,-4);
var var1 = avg1_2*avg2_4;
Hope this helps
AlexComment
Comment