Announcement

Collapse
No announcement yet.

$HSI.X-HKG delay

Collapse
X
 
  • Filter
  • Time
  • Show
Clear All
new posts

  • $HSI.X-HKG delay

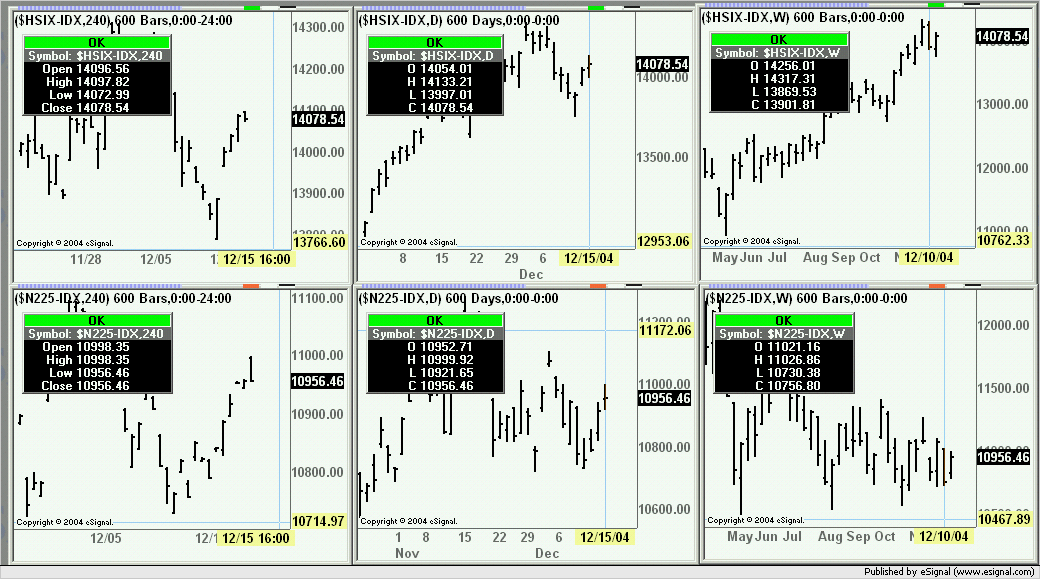
    I live in HK and I notice that there is a delay of $HSI.X-HKG. It should be able 14211.84 now. But eSignal is showing 13926.6 on the daily chart and 14066.9 on the 240minute chart.


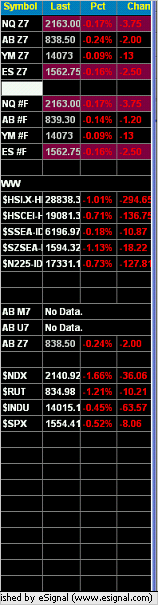
    Would someone pls advise?

  • #2
    I also posted something about this the other day and the thread below should give you more information.

    Comment


    • #3
      I hv tried $hsix-idx but still there is huge delay. Besides, it is not showing intraday data at all.

      Same case for $n225-idx, it is showing great delay for daily and weekly data and don't show data for intrday chart at all.

      Is there a fix?? If not, I hv to cancel subscribing these indices and just use the futures data... thx.

      Comment


      • #4
        Hello Richard,

        I wanted to touch base with you regarding your Advanced Charts of $HSIX-IDX & $N225-IDX. I wanted to see if you were still experiencing a delay with these symbols. As for the chart not displaying any intraday data, is the cursor window displaying the "NO DATA" message? There are a series of troubleshooting steps that you can perform if this is the case, but I would like to confirm any error messages you are receiving before we head down that road.

        As you also made mention of this behavior before the symbol changed, it sounds like there may be some sort of connectivity issue at play here, but again, I would like to confirm any other details you can provide in regards to this. I'm including the link to an article from the eSignal Knowledge Base that talks about some common connectivity issues and the corresponding resolutions.

        Comment


        • #5
          Below is the snapshot of the screen. Today N225 should close at 10956.46 and HSI should close at 14078.54. Weekly data is not correct and there are no intraday data. Besides, I am not sure whether the daily data are also correct during the market time (or just after the market) since I was not before the monitor today.

          I hv also included the charts for TOPIX LARGE70 and strangely they are showing data correctly.

          Comment


          • #6
            Richard
            FWIW here is what I am seeing at my end for those symbols
            Alex

            Comment


            • #7
              So any suggestion for me?? Actually it has been like this for a long time and never hv I been able to find a solution. thx.

              Comment


              • #8
                Below is the snapshot of $INDU and $SPX. The intraday charts are ok but again the weekly charts are not right... I stay in HK but I am using Eastern Time in my computer...

                Comment


                • #9
                  This is the PG file I am using:


                  This is the EFS file to show the present price:


                  thx.

                  Comment


                  • #10
                    Hi Richard,

                    I've been working with this from multiple Time Zones and haven't been able to replicate it thus far. Here is what I am seeing from both the PST and EST time zone settings. I saw that you posted while I was composing this. I'll download the Page file you provided and see if I can replicate it with the exact piece of work you are currently involved with. I'll report back shortly with my findings.

                    PST


                    Eastern Standard Time


                    Comment


                    • #11
                      Hi Richard,

                      There may be something amiss here. When I attempted to download the Page file you provided, here is the message I received. If you could attach it to a post, or send it to me via PM, I'll try to work with it that way. Thanks.

                      Comment


                      • #12
                        Richard
                        The efs you posted was originally intended for a different purpose and includes a condition which is preventing it from displaying the current bar's Close and displays instead the prior bar's Close.
                        If you wish to write the current price to the chart use the enclosed script which will return the correct value
                        Alex

                        PHP Code:
                        function preMain() { 
                            
                        setPriceStudy(true); 
                            
                        setStudyTitle("Present Price"); 
                            
                        setShowCursorLabel(false); 


                        function 
                        main() { 

                            
                        drawTextAbsolute(210close(0), Color.limeColor.blackText.BOLD|Text.LEFT|Text.RELATIVETOTOP|Text.RELATIVETORIGHTnull12"TR"); 
                            
                            return; 

                        Comment


                        • #13
                          So we know I hv to modify the EFS to show the correct last price. But how about the intraday chart showing nothing?? This should hv nothing to do with the EFS.... thx.
                          Last edited by Richard Yu; 12-19-2004, 01:43 AM.

                          Comment


                          • #14
                            Hi Richard,

                            I haven't been able to download the Page file that you attached in your earlier post. I would like to take a look at the file in question to see if we can replicate it on this side. Please let me know.

                            Comment


                            • #15
                              You may find the page file "eSignal Page - MPF.pg" at the user group "Richard Yu Group". It is open to public. thx.
                              Last edited by Richard Yu; 12-17-2004, 04:31 AM.

                              Comment

                              Working...
                              X