Announcement

Collapse
No announcement yet.

addBand in 7.8

Collapse
X
 
  • Filter
  • Time
  • Show
Clear All
new posts

  • addBand in 7.8

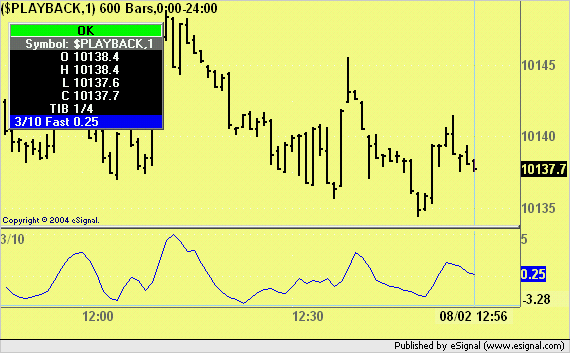
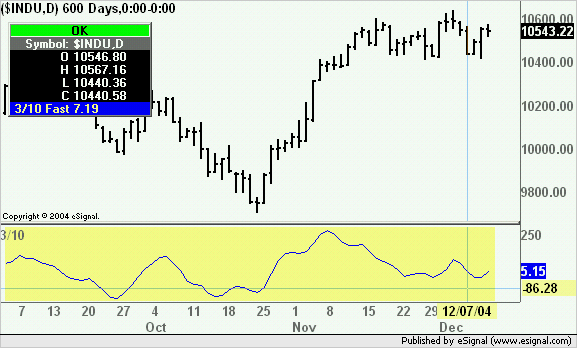
    behavior has changed so that addband now seems to overwrite or be on top of everything. I would like addBand to exhibit the previous behaviour of it always being underneath as a background color. Of course, if setChartBG worked correctly that would be OK too, but that has never worked. Flashes on ALL charts than reverts back to white.

    Thanks,
    Mike

  • #2
    Mike
    With regards to setChartBG() I use it regularly without any problems. The issue could be caused by how the conditions are set in the efs. Perhaps you may want to post a sample efs that is causing the behavior you describe.
    Alex

    Comment


    • #3
      This very simple example causes the entire chart page to flash paleyellow when called, than go back to white.

      var study3 = new MAStudy(3,0,"Close", MAStudy.SIMPLE);
      var study10 = new MAStudy(10, 0,"Close", MAStudy.SIMPLE);


      function preMain() {
      setStudyTitle("3/10");
      setCursorLabelName("3/10 Fast",0);
      }

      function main()
      {
      var v3 = study3.getValue(MAStudy.MA);
      var v10 = study10.getValue(MAStudy.MA);
      var vFast = v3-v10;
      setChartBG(Color.paleyellow);
      return vFast;
      }

      Thanks,
      Mike

      Comment


      • #4
        Mike
        FWIW I just ran the efs on two computers (one with 7.7 and the other with 7.8) in Tick Replay and in both cases the chart background remained a solid light yellow (the default background of the chart is white).
        It would seem that there may be something else other than the setChartBG() command that is causing the issue you are seeing.
        Alex

        Comment


        • #5
          I just want the chart labled 3/10 to have a colored background, not the entire chart page. addBand used to work fine for this but no longer works. It seems to work correctly on the main chart, but not on the script generated charts. That is, on main chart addBand seems to have the characteristic "alwaysonbottom" while on the script charts the characteristic is 'alwaysontop". This would seem to be a bug in the new code as it makes no sense for the behaviour to be different depending on which chart you are looking at.

          If there is a way to just have the background of the 3/10 chart change color I would try that workaround.

          Thanks,
          Mike

          Comment


          • #6
            Mike
            You mean like in the image enclosed here?
            If yes simply change setChartBG(Color.paleyellow) to setBarBgColor(Color.paleyellow)
            As to the change in behavior of addBand() that was requested AFAIK by many users myself included. This is because if you used the command setBarBgColor() the background color would paint over the band(s). The way it is now in version 7.8 the band will appear on top of the background color which IMHO is the way it should be.
            For example if you wanted to add a band to mark the 0 line in your indicator you will now be able to see the band whereas before it would have been hidden
            Alex

            Comment


            • #7
              The problem with setBarBGColor is that it is persistent with the bars. That is, if you change colors, you only change the color on the new bar, not the entire background. If esignal wants to change fundmantal behaviour of functions, there should always be a way for legacy users to maintain old characteristics. Maybe add a flag for always on top or bottom. The fact that the behaviour is different in the main chart and the subcharts shows this was not really thought through very well.

              Being able to que off background color is a very important feature that is no longer available as best as I can tell. That is, I like to set the background color of my charts depending on if they are in 'buy' or 'sell' setups. That way I can see at a glance what the condition of all my charts are. That is a very important visual que for me that is no longer available as best as I can tell.

              Thanks,
              Mike

              Comment


              • #8
                Mike
                The behavior of setChartBG() has not been altered AFAIK and as I said earlier works fine.
                As to addBand() the behavior is exactly the same whether it is plotted in the price window or in an indicator window.
                You may want to give a practical example of what you are tring to achieve and someone may come up with a solution
                Alex

                Comment


                • #9
                  Here is the complete script. The line
                  "addBand(0, PS_SOLID, 300, Color.RGB(0xE0, 0xE0, 0xE0),"zz");"
                  used to add a nice background, now it covers the indicator chart and makes it a solid grey when called.

                  What I am trying to do is change the background of the indicator chart depending on state. addBand used to work for this, it no longer does.


                  var study3 = new MAStudy(3,0,"Close", MAStudy.SIMPLE);
                  var study10 = new MAStudy(10, 0,"Close", MAStudy.SIMPLE);


                  function preMain() {
                  /* Set the title that will appear in the study pane */
                  setStudyTitle("3/10");
                  setCursorLabelName("3/10 Fast",0);
                  setCursorLabelName("3/10 EMA",1);
                  setCursorLabelName("3/10 Dir",2);
                  setDefaultBarFgColor(Color.red, 0); // 3
                  setDefaultBarThickness(2, 0);
                  setDefaultBarThickness(2, 1)
                  setDefaultBarThickness(1, 2)
                  setPlotType(PLOTTYPE_HISTOGRAM, 0);
                  setPlotType(PLOTTYPE_HISTOGRAM, 2);
                  var fp1 = new FunctionParameter("EMALength", FunctionParameter.NUMBER);
                  fp1.setLowerLimit(1);
                  fp1.setDefault(50); //Edit this value to set a new default
                  var fp2 = new FunctionParameter("bInput", FunctionParameter.BOOLEAN);
                  fp2.setName("Bool Input");
                  fp2.setDefault(true);

                  }

                  var vLast = 0;
                  var prevcolor = Color.paleyellow;
                  var prevemacolor = Color.paleyellow;

                  var emaMult = 2/(1+50);
                  var vPrevEma = 0;
                  var vEma = 0;
                  var count = 0;
                  var dir = 0;
                  var lastDir = 0;
                  var dirContra = 0;
                  //var textPos;

                  function main(Length, bands)
                  {
                  var v3 = study3.getValue(MAStudy.MA);
                  var v10 = study10.getValue(MAStudy.MA);
                  var vFast;
                  var tempref = ref(-1);
                  var closePos;
                  if (tempref != null)
                  vLast = tempref[0];
                  else
                  {
                  vLast = 0;
                  if (Length == null)
                  Length = 50;
                  emaMult = 2/(1+Length);
                  if (bands == null)
                  bands = true;
                  if (bands == true)
                  {
                  addBand(1, PS_SOLID, 2, Color.red,"aa");
                  addBand(-1, PS_SOLID, 2, Color.green,"bb");
                  addBand(0.0, PS_SOLID, 1, Color.black,"cc");
                  addBand(.5, PS_DASHDOT, 1, Color.red,"dd");
                  addBand(-.5, PS_DASHDOT, 1, Color.green,"ee");
                  }
                  }

                  if (count < 8)
                  {
                  count++;
                  vFast = 0;
                  }
                  else
                  vFast = v3 - v10;

                  if (getBarState() == BARSTATE_NEWBAR)
                  {
                  if (prevcolor == Color.red)
                  addBand(0, PS_SOLID, 300, Color.RGB(0xE0, 0xE0, 0xE0),"zz");
                  // setBarBgColor(Color.RGB(0xE0, 0xE0, 0xE0));
                  // drawShapeAbsolute(1, 0, Shape.UPARROW, null, Color.RGB(0xE0, 0xE0, 0xE0), Shape.ONTOP | Shape.RIGHT , "zz");
                  //drawTextAbsolute(1, 0, close(-1), prevcolor, null, Text.FRAME, "Courier", 10, "yy" );
                  else
                  addBand(0, PS_SOLID, 300, Color.paleyellow,"zz");
                  // setBarBgColor(Color.paleyellow);
                  // drawShapeAbsolute(1, 0, Shape.DOWNARROW , null, Color.paleyellow, Shape.ONTOP | Shape.RIGHT , "zz");
                  //drawTextAbsolute(1, 0, close(-1), prevcolor, null, Text.FRAME, "Courier", 10, "yy" );
                  if (vLast > vPrevEma)
                  {
                  if (lastDir < 0)
                  {
                  lastDir = 1;
                  dirContra = 0;
                  }
                  else
                  {
                  if (vFast < vLast)
                  dirContra++;
                  lastDir++;
                  }
                  }
                  else
                  if(vLast < vPrevEma)
                  {
                  if (lastDir > 0)
                  {
                  lastDir = -1;
                  dirContra = 0;
                  }
                  else
                  {
                  if (vFast > vLast)
                  dirContra++;
                  lastDir--;
                  }
                  }
                  else
                  {
                  if (lastDir > 0)
                  lastDir++;
                  else if (lastDir < 0)
                  lastDir--;
                  }
                  //drawTextAbsolute(18, 0, lastDir, prevcolor, null, Text.FRAME | Text.BOLD, "Courier", 10, "xx" );
                  vPrevEma = vEma;
                  }
                  vEma = emaMult*(+vFast-vPrevEma)+vPrevEma;
                  // if (textPos > 0)
                  // closePos = -.55;
                  // else
                  // closePos = 1;
                  if (vFast > vLast)
                  {
                  setBarFgColor( Color.grey,0);
                  prevcolor = Color.darkgreen;
                  //drawTextAbsolute(4, 0, close(), prevcolor, null, 0, "Courier", 10, "ww" );
                  }
                  else
                  if (vFast < vLast)
                  {
                  setBarFgColor( Color.red,0);
                  prevcolor = Color.red;
                  //drawTextAbsolute(4, 0, close(), prevcolor, null, 0, "Courier", 10, "ww" );
                  }
                  else
                  //drawTextAbsolute(8, closePos, close(), Color.grey, null, 0, "Courier", 10, "ww" );
                  if (vFast > vEma * 0)
                  {
                  if (lastDir < 1)
                  dir = 1;
                  else
                  dir = lastDir + 1;
                  if (dir == 1)
                  dir = 1.5;
                  else
                  dir = 0;
                  setBarFgColor( Color.green,1);
                  prevemacolor = Color.red;
                  }
                  else
                  if (vFast < vEma * 0)
                  {
                  if (lastDir > -1)
                  dir = -1;
                  else
                  dir = lastDir - 1;
                  if (dir == -1)
                  dir = -1.5
                  else
                  dir = 0;
                  setBarFgColor( Color.red,1);
                  prevemacolor = Color.green;
                  }

                  // return new Array(vFast,vFast, vEma,dir);
                  return new Array(vFast, vEma);
                  }


                  Thanks,
                  Mike

                  Comment


                  • #10
                    Mike
                    Here is a solution for you using setBarBgColor() and setBar(). All changes applied to your script are commented with //added by ACM.
                    For more information on setBar() see this article in the EFS KnowledgeBase
                    Hope this helps
                    Alex
                    Attached Files

                    Comment


                    • #11
                      Tried using "drawTextAbsolute(-111, 10, "####", null, null, null, "Courier", 180, "yy" );"

                      That is also writing over the study now even though the "Text.ONTOP (Draws the text on top of the study. Otherwise, the study will be drawn on top of the text)" flag is not set.

                      Mike

                      Comment


                      • #12
                        Alex,
                        Thanks for all the time you've taken with this.

                        There is of course a performance hit with your solution. Since I use this technique about 35 times, hard to know the cost. I got rid of my drawText calls because of their relatively high overhead. For now, my solution is to draw a side bar using
                        "drawTextAbsolute(1, 10, "....", null, Color.paleyellow, null, null, 180, "yy" );"

                        I hope esignal will provide a more elegant solution by putting a flag on addBand or making the "Text.ONTOP" flag work correctly.

                        Thanks again,
                        Mike

                        Comment


                        • #13
                          Mike
                          You can contain that performance draw by substituting vCntr with a fixed value in the for loops. That way you would repaint only the amount of bars that you want.
                          More importantly you now have an alternative solution available to you
                          Alex

                          Comment

                          Working...
                          X