jbfox
By default the Line/Tick chart is based on the Close.
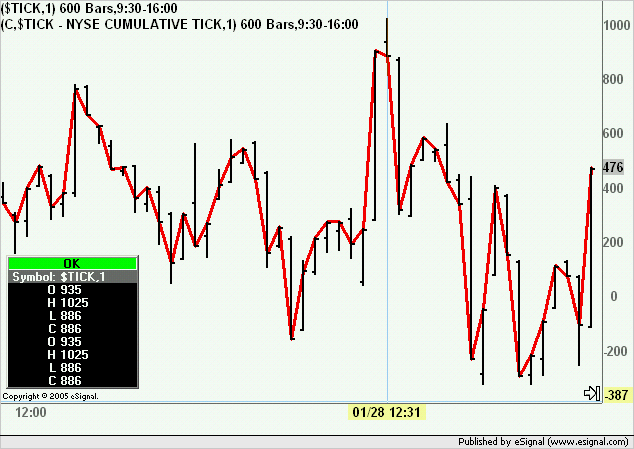
In the image below I have overlayed a Line/Tick chart of $TICK on top of the bar chart for the same symbol and as you can see the Line/Tick chart plot indicates the Close.
If you look in the Study Title of the image (and also in that of the image you posted) you will see that it shows (C, $TICK - NYSE... where the C stands for Close.
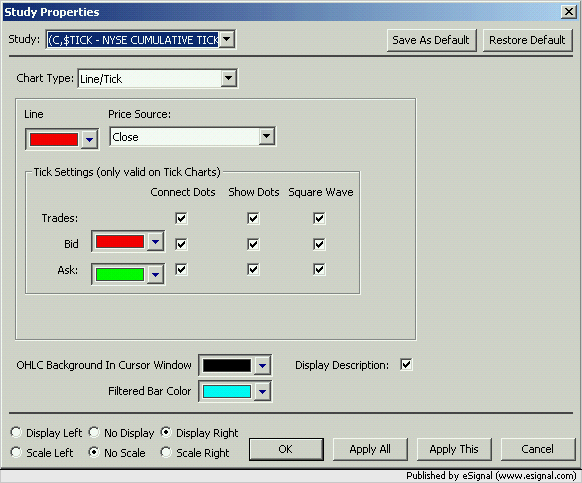
In Edit Studies you can select what value to use for the Line/Tick chart (see image below)
Alex
 Tweet
Tweet
Comment