 Tweet
Tweet
Hi, I am having a trendline problem. I draw a trendline on a 60min chart when I switch to daily view the trendline looks as it should, 30 min view the trendline looks as it should, but if I go to 15 min the tredline has completely moved, the same trendline runs across the chart about 20 points above where it should be.
-
Hope for the best.....Plan for the worst! -
Ok now here's a weird development on this. 15min chart is as described, but if I scroll back to where the trendline starts and then scroll forward again the trendline drops right into place Hope for the best.....Plan for the worst!
 -
dhunniford
Are you using a Time Template where the # Bars/Days is Dynamic (ie either set to 0 or not set at all) for the 15 min interval?
That could explain why scrolling backward and then forward again resolved the issue ie because by scrolling backwards you requested more data that was required for the intial anchor point of the trendline.
AlexComment
-
Hi Alexis, I was using a custom template with data requested fpr 60 days, the anchor point for the trendline in this particular case was the high on the SPX which is well inside the 60 days specified. I have also just changed to dynamic today and that still makes no difference.Hope for the best.....Plan for the worst!Comment
-
dhunniford
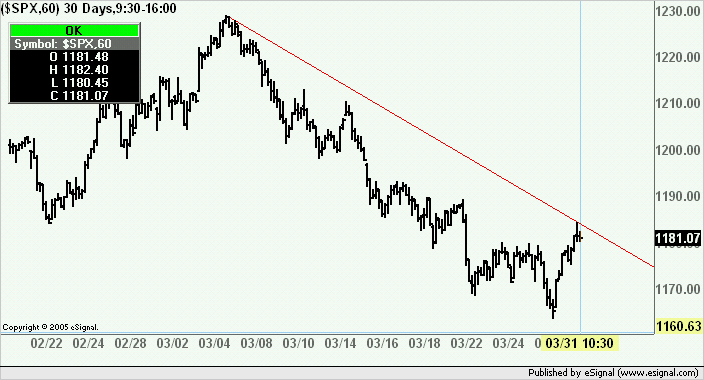
What are the extremes of the anchor points on the 60 min chart of $SPX?
Also you may want to post a screenshot of the Time Template you are using so as to replicate the same conditions
AlexComment
-
Thanx for your responses Alexis, give me some time and I will work on meeting those requests. In the mean time an experiment, put a 60 min chart of $SPX full screen on a monitor, find a decent distance to draw a trendline across the screen and not the point in value that it will leave the right hand side of your screen, now reduce the time frames and note the point at which it leaves the frame, I am finding large value differences and that I can change that value by back scrolling to the origin in the smaller timeframe and then scrolling forwards. The implication obviously being that in say a 15 or even 5 min time frame I think I am coming up on a trendline when in reality I may be nowhere near it. If its any hlp I first noticed this in $SPX, I had a custom Time template in force at the time but I erased the trendline and change to dynamic mode, the trendline is anchored at the recent year high and runs through to today, it was drawn on a 60 min advanced candlestick chart, log view, I find the variation in trendline location within a 15min chart today as much as 20+ points out.
As I say when I get time I will post screenshots of this am finding it in all my charts now.Hope for the best.....Plan for the worst!Comment
-
dhunniford
Unless I am misunderstanding your process I am not seeing the issue
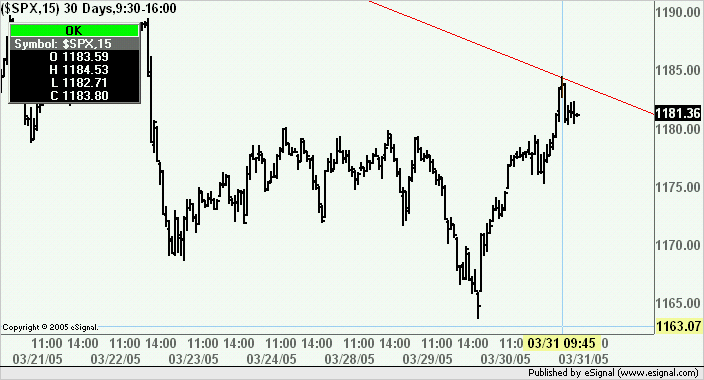
Here below is a 60 min chart of $SPX in which I have drawn a trend line. In the following image you can see the same trend line on the 15 min chart. The second image was obtained by just switching intervals without scrolling back and forward.
Alex
Comment
-
Ok 60min chart, note the position of the trendlineAttached FilesHope for the best.....Plan for the worst!Comment
-
-
30 min looks okAttached FilesHope for the best.....Plan for the worst!Comment
-
-
15 min doh! wheres that trendline?Attached FilesHope for the best.....Plan for the worst!Comment
-
-
New twist, here's the 5 min Trendline is back, but note the level, it's in a different place. Now if I scroll back to origin and forwards I can bring it down to where it should be
Attached FilesHope for the best.....Plan for the worst!Comment
-
-
dhunniford
Notice that your Time Template for 5 and 15 minute intervals are set to Dynamic.
What happens is that when you open the 5 and 15 min charts in Dynamic mode not enough data gets loaded in the chart to plot the trend line because the initial anchor point is further back on the 30 minute chart.
The moment you scroll back you request more data and as soon as the bar that is the anchor point is loaded the trend line reappears.
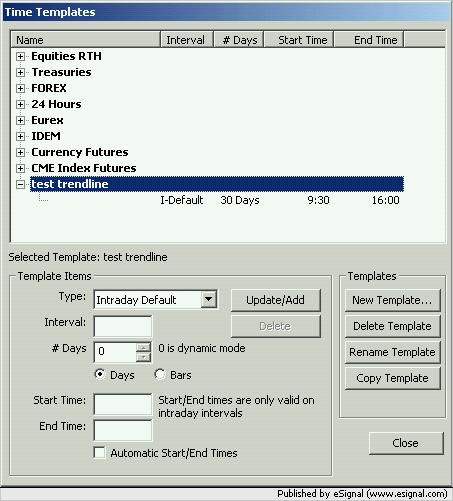
Set up a Time Template as in the following image and you should no longer have the problem
Alex
Comment
-
I don't get the significance of that since there is nothing wrong with the 30min chart it's the 15 and 5 that are the problemLast edited by dhunniford; 03-31-2005, 09:40 AM.Hope for the best.....Plan for the worst!Comment
-
dhunniford
Try creating a Time Template as the one shown in the image I enclosed in the prior message and see if the problem disappears.
AlexComment
-
I will give it a try but it is worth knowing that I have had a 60 day data template running also. The fact that the line is missing completely on the 15 min and appears on both the 30 and the 5, albeit at the wrong level on the 5 suggests to me that this will not make a difference, if it was missing from the 5 min as well then maybe, assuming that a template was in place for number of bars. But that is not the case. It is a disturbing developement as if you view trendlines as areas of support / resistance opening a trade right next to one when you don't know it is there has obvious implications.Hope for the best.....Plan for the worst!Comment
Comment