Announcement

Collapse
No announcement yet.

Total Volume

Collapse
X
 
  • Filter
  • Time
  • Show
Clear All
new posts

  • Total Volume

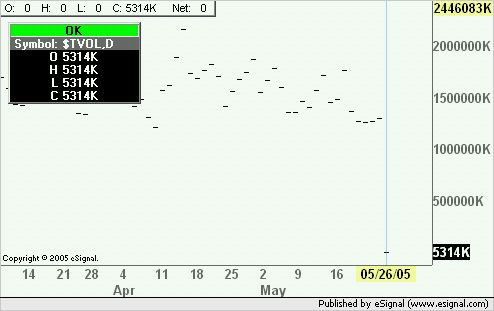
    Can someone explain to me what I am looking at here, ie why the candles take on this form. Surely volume should start the week at zero and progress up throughout the week. Same weirdness exists if you try to get a daily volume, the candle appears as a mere speck. Surely the opening should have been zero and the close whatever.
    Thanx
    Attached Files
    Hope for the best.....Plan for the worst!

  • #2
    Oh dear 4 days and 17 odd views and nobody can offer any explanation why weekly volume appears like this?
    Hope for the best.....Plan for the worst!

    Comment


    • #3
      Hi dhunniford,

      We've been able to replicate this. It does look like the low is the incorrect figure in this data set. We are working with the QA department to see what may be happening here....Thanks for the heads up. As soon as I know more, I'll reply back to this thread.

      Comment


      • #4
        Ok Duane, thanx for the reply, any intraday timer frame seems fine but as soon as you step outside that it all goes to rat........
        Well you know what I mean, take a look at daily, lile a page of freckles.
        Anyways I'll leave it with you.
        Hope for the best.....Plan for the worst!

        Comment


        • #5
          dhunniford
          FWIW with regards to the daily charts eSignal transmits only the closing value of these symbols.
          As to the weekly charts the only value that appears incorrect is the Low (as Duane already pointed out) which should be the lowest closing value during the week. Weekly Open High and Close instead reflect the daily values.
          Alex

          Comment


          • #6
            Alexis, ok that would provide an explanation, though seems odd since the value should simply start at zero since the system seems to know to start at zero on say a 60 min intraday. It;s not a crisis thing anyways, doesn't feature in my trading since I normally monitor these symbols on a 60 min intraday which works just fine. The only reason I noticed was that I was trying to compare daily and weekly volume to the daily and weekly charts, as Nasdaq and S&P charts don't show daily volumes.
            Hope for the best.....Plan for the worst!

            Comment


            • #7
              dhunniford
              It actually will show a value that is closer to 0 in the opening seconds of the day (see enclosed image of the daily chart of $TVOL taken just after the market opened), but since eSignal transmits only the Last on a daily chart the values for OHLC shown will progressively reflect the cumulative total(s) only.
              Alex

              Comment


              • #8
                Hmmn yes Alexis, that is what I have on my chart, I am not a software programmer but I would not have imagined it would be that difficult to fix given eSignals otherwise comprehensive charting abilities.

                On that subject, and related to the volume issue, why is it possible to get daily volume on an advanced chart for $INDU, but not possible for $COMPQ, or $SPX, or $NDX, I'm sure the list goes on. Currently if I want to see whether volume increased or declined on the SPX I have to go to somewhere like stockcharts.com.
                Hope for the best.....Plan for the worst!

                Comment


                • #9
                  dhunniford

                  On that subject, and related to the volume issue, why is it possible to get daily volume on an advanced chart for $INDU, but not possible for $COMPQ, or $SPX, or $NDX...

                  Someone from eSignal will be in a better position to reply to the question. As far as I know the exchange does not provide that data (see the enclosed image which was taken from CBOE's own web page)
                  Alex

                  Comment


                  • #10
                    Thanx for posting that image, that is interesting, obviosly someone provides such information since these people can get hold of it.
                    Attached Files
                    Hope for the best.....Plan for the worst!

                    Comment


                    • #11
                      dhunniford
                      I suspect that some providers simply add up the daily volumes of the components of the index. The attached file lists all the components with their corresponding volumes and provides a total of the volume. As you can see that is in line with what is shown in the chart you posted
                      Alex
                      Attached Files

                      Comment


                      • #12
                        Actually, I would be happy to see that approach on eSignal too. Total volume of components is fine by me!

                        Originally posted by Alexis C. Montenegro
                        dhunniford
                        I suspect that some providers simply add up the daily volumes of the components of the index. The attached file lists all the components with their corresponding volumes and provides a total of the volume. As you can see that is in line with what is shown in the chart you posted
                        Alex

                        Comment


                        • #13
                          I agree with Anson.


                          The total volume of components, it is satisfactory.

                          It is inconceivable tht E-signal does not offer when there are provides much cheaper that offer volumes of djia30 ($indu) in iuntraday periods , i.e. Prophet .
                          I even think that Quote in it Livecharts offers only for dollars 9.

                          Comment


                          • #14
                            What a mess, don't know what is going on with the volume charts but it is getting really silly no.
                            Attached Files
                            Hope for the best.....Plan for the worst!

                            Comment

                            Working...
                            X