 Tweet
Tweet
Is it possible to plot a 60min EMA with a RTH time template on a 5min chart with a 24hr time template? thx.
-
-
Richard
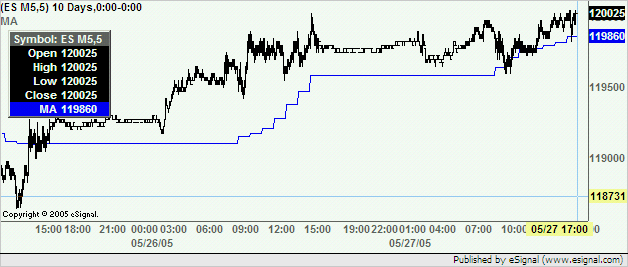
Yes it is possible (see image below)
Alex
-
Would u pls show me the EFS2 codes? The ema() function does hv the parameter to specify the time template....
ema( length [, source | sym() | inv()] [, barIndex] )
Last edited by Richard Yu; 05-28-2005, 07:21 AM.Comment
-
Richard
To create that image I used the customMA.efs which is in the EFS2 Custom subfolder of Formulas so you already have the script
AlexComment
-
I hv checked and it contains below parameters:
- Type,Length,Source,Symbol,Interval,Offset,Params
So for a 60min 20-EMA with RTH time template, I should set it as:
- Type: ema
- Length: 20
- Source: close
- Symbol: default
- Interval: 60
- Offset: 0
- Params: default
However, it still doesn't hv the parameter for the time, ie, 9:30-16:15. How can it be set? thx.Last edited by Richard Yu; 05-28-2005, 09:19 AM.Comment
-
Richard
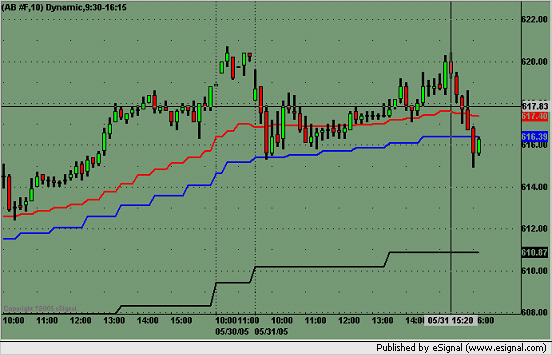
There is no start/end time parameter in the inv() function. The function uses the settings you have defined in the Time Template for the specific interval you are calling.
So in the Time Template loaded in the chart you set the 5 minute User Defined interval to 24 hours and the User Defined 60 min interval to 9:30-16:15 start/end times.
AlexComment
-
Below efs plots the EMAs of 30, 60 and 240min on a 10min chart. However, the EMAs are not updated every tick. How should I modify the codes? thx.
function main(EMA_Interval_1, EMA_Interval_2, EMA_Interval_3)
{
return new Array (ema(20, inv(EMA_Interval_1)), ema(20, inv(EMA_Interval_2)), ema(20, inv(EMA_Interval_3)));
}
Comment
-
Richard
As far as I can see at my end they are updating at every tick
AlexComment
-
attached is the efs. it is very simple and I don't understand why it isn't updated on each tick.... Pls advise. thx.Comment
-
-
Richard
As I said in my prior reply the efs is updating on every tick at my end.
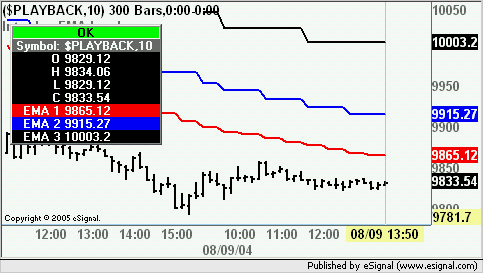
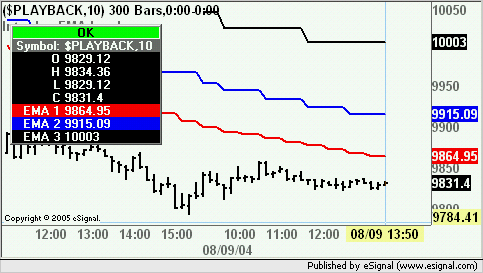
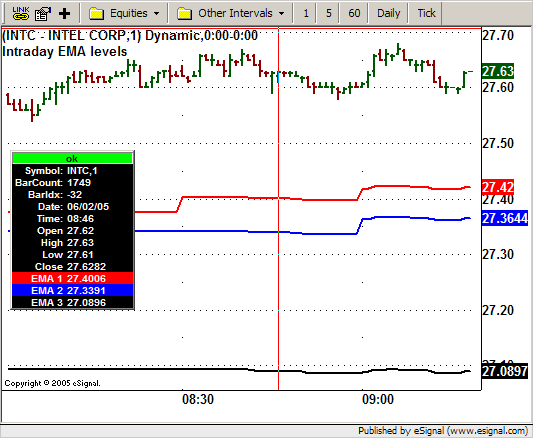
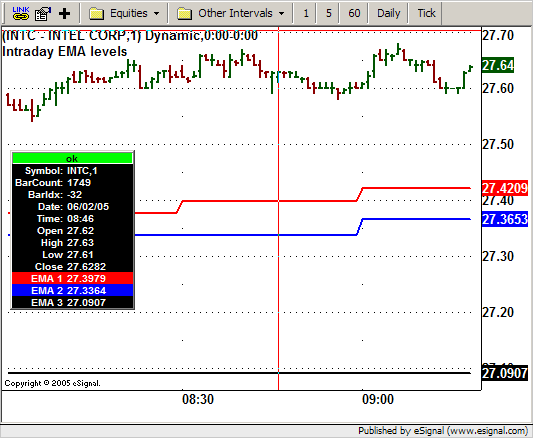
The following two images show the efs running in Tick Replay and were captured a few minutes apart on the same bar. Notice that the values of all three averages have changed.
Alex
Comment
-
I am sorry. Actually it is updated on every tick. But what I want is to hv a smooth 240min 20EMA on a 10min chart. Right now the 240min 20EMA will keep flat for 240min. Same case for other EMA too. How to hv a smooth line instead of a stepping line? thx.Comment
-
Hello Richard,
You won't be able to plot smoothed ema lines when the multiple time frame emas initially load. This is because the values are based on completed bars during initialization. On a 1-minute chart, you will see a flat line for 240 minutes for the 240 min interval. During the loading process there is only one value available for each 240 min bar in the higher time frame. However, once the study is processing real time data you have the option to plot the synched (stair-stepped) line or the smoothed line. To plot the synched line, you return the series objects as you currently are. To plot the smoothed line, return the .getValue(0) value from each series. You'll see something like below.
The code for main would look like this:
Keep in mind that if you reload the formula, you will get the synched (stair-stepped) lines again.PHP Code:function main(EMA_Interval_1, EMA_Interval_2, EMA_Interval_3)
{
var e1 = ema(20, inv(EMA_Interval_1));
var e2 = ema(20, inv(EMA_Interval_2));
var e3 = ema(20, inv(EMA_Interval_3));
return new Array (e1.getValue(0), e2.getValue(0), e3.getValue(0));
//return new Array (ema(20, inv(EMA_Interval_1)), ema(20, inv(EMA_Interval_2)), ema(20, inv(EMA_Interval_3)));
}
 Jason K.
Project Manager
eSignal - an Interactive Data company
EFS KnowledgeBase
JavaScript for EFS Video Series
EFS Beginner Tutorial Series
EFS Glossary
Custom EFS Development Policy
New User OrientationComment
Comment