 Tweet
Tweet
i'm wondering, is it possible to draw a line on a chart and have the line just stay there, based on price, not symbol? when i draw a line now on a chart and the symbol is, say MSFT, it will be there everytime i pull up MSFT. but how can i make it so it remains at the price level i put it at until i physically remove it, regardless of symbol? i'm wondering if this is possible when drawing lines on a study as well.
-
-
The only thing I can think of would be to use an EFS script to accomplish the task. In the script, use the AddBand() function to draw the line at the price level(s) you desire and then load the EFS script into your advanced chart. Then, whenever you change symbols, the script will still be loaded and will continue to draw the lines at the price levels.
Chris -
Hello passterelli,
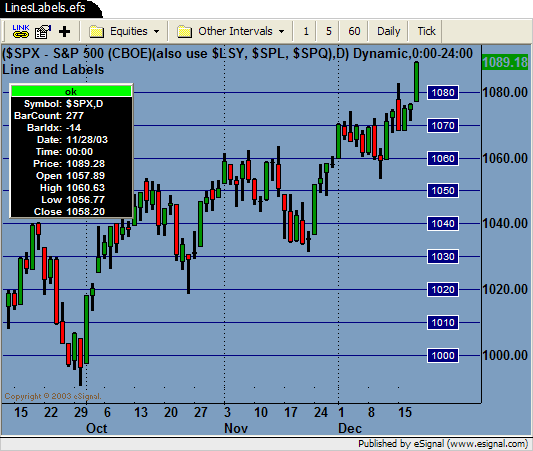
The formula below was developed for a similar request that you might find useful for this situation. It will draws up to 30 horizontal lines with labels at price levels specified by the user through the “Edit Studies” option.
Formula Parameters:
vEditing: Default is False (True/False).
nThickness: Default is 2 (controls line thickness of all lines).
nColor: Default is Black (controls color of all lines).
Valid inputs for nColor: aqua, black, blue, brown, cyan, darkgreen, darkgrey, fushcia, green, grey, khaki, lightgrey, lightyellow, lime, magenta, maroon, navy, olive, paleyellow, purple, red, teal, white, yellow
L1 through L30: No default values (price levels for the lines).
L1label through L30label: No default values (labels for the lines).
This formula has an additional feature built in to it that automatically draws the same lines and labels on other charts that you apply this formula to. For example, let’s say you have three charts of $SPX with intervals of 1 minute, 5 minutes and 10 minutes. Apply the formula to one of the charts, go to the “Edit Studies” option and enter “True” for vEditing. This just tells the formula that all the data for the lines and labels will come from this particular chart. Then add a couple of lines and labels by entering the desired price for L1 etc. Now apply the same formula to the other two charts and you will see the same lines and labels drawn on those charts. If you change any of the data for the lines in your original chart, you will just have to right-click and reload the formula on the other charts.
LinesLabels.efs
 Jason K.
Project Manager
eSignal - an Interactive Data company
EFS KnowledgeBase
JavaScript for EFS Video Series
EFS Beginner Tutorial Series
EFS Glossary
Custom EFS Development Policy
New User OrientationComment
Comment