 Tweet
Tweet
I am using the canned version of PSAR with the standard settings 0.02,0.02,0.20 and $NDX symbol. I am getting different values from the daily chart vs. the daily tabular as well as using eSignal data in Amibroker. The chart values are a day ahead of the other sources. Does anyone know what the code that eSignal uses for the default PSAR chart? Is there some reason for the descrepancy in the chart vs. tabular values?
-
-
bobolsen8
When referring to "daily chart" do you mean an Advanced Chart or a Standard Chart? Also with "tabular data" are you referring to the Standard Chart tabular display or other?
Anyhow the calculations in Advanced and Standard Charts are the same with the difference being that the Parabolic in the Standard Charts is calculated on a completed bar only while the one in the Advanced Charts is dynamic meaning it also includes the current bar's calculation. However even though it may be showing a certain value on the current bar it will flip only if the value of the Parabolic at the prior bar is breached.
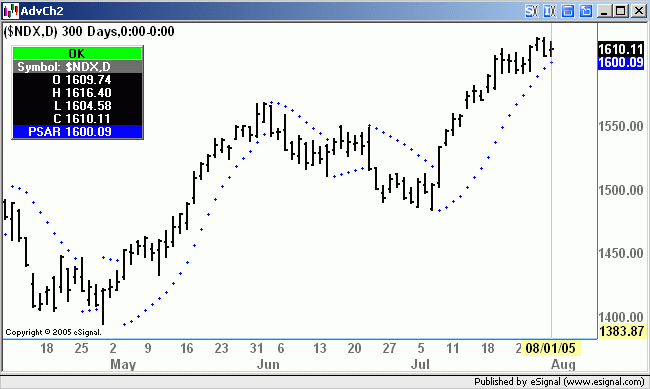
Here is a sequence of images I created using the Bar Editor Tool to illustrate this behavior. In the first image you can see that the value of the Parabolic for the current bar is 1600.09 while the prior value is 1595.12. BTW this is the value shown in Standard Charts (either in chart or tabular mode). Other programs such as Metastock for example calculate it in the same way as Standard Charts
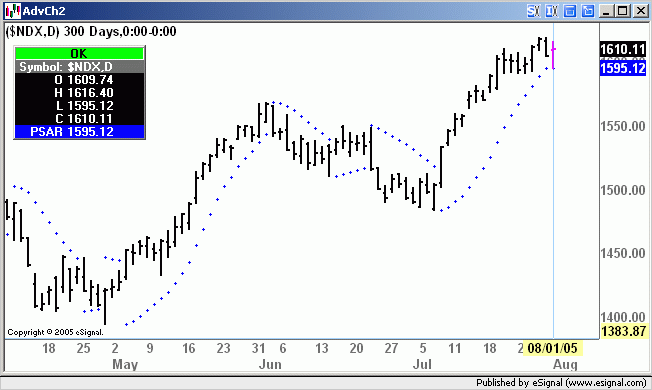
Using the Bar Editor I then modified the Low of the current bar to match that of the value of the Parabolic at the prior bar ie 1595.12. You will see that the Parabolic dynamically backs off from its original value of 1600.09 and still remains in long mode.
Using again the Bar Editor I modified the low of the bar to breach the value of the Parabolic at the prior bar. As you can see the Parabolic dynamically flips to short mode on the same bar. Standard Charts (and Metastock) will instead wait for the next bar to flip.
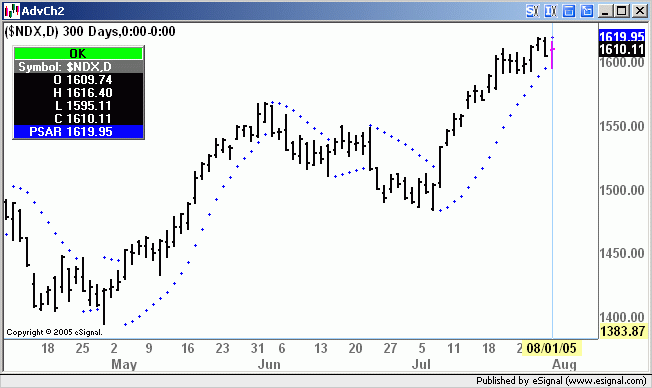
Ultimately the result is the same except that Advanced Charts provide a dynamic representation of the Parabolic whereas Standard Charts (and some other programs) use a "compute on close" approach.
Alex
Comment