 Tweet
Tweet
I hope I can make myself understood:
On a current chart I am able - through the scroll function - to set the chart up in such a way that the new candles will appear quite a distance away from the right edge of the chart. Mostly the new formed candles in my charts show up pretty much in the center of a chart. This is just a personal setting I like.
Sometimes I like to train my eyes for certain patterns by scrolling through the replay funtion of a chart. Here the candles pop up pretty much at the very right side of the chart, almost next to the price broder.
Is it possible to somehow change the distance the candles will pop up from the right side of the chart when I scroll through back data, so that it will look more like when I watch real time charts, which is more to the center of the chart?
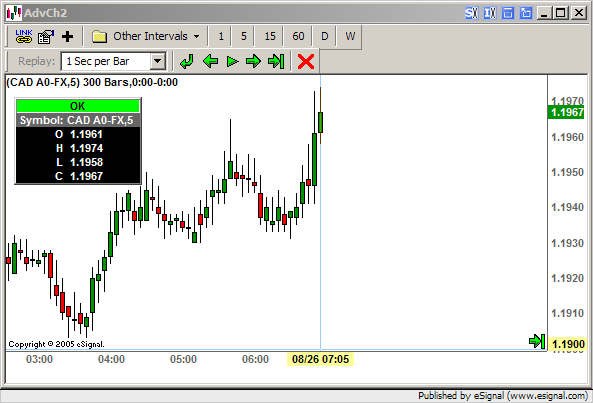
I have attached a chart. Here you can see how I like to look at charts. On current data the new formed candles will pop up in the center. But when using back data the candles will move the very right edge and appear from there. I would like to have the candles apear more to the left also. Is this possible to accomplish?
On a current chart I am able - through the scroll function - to set the chart up in such a way that the new candles will appear quite a distance away from the right edge of the chart. Mostly the new formed candles in my charts show up pretty much in the center of a chart. This is just a personal setting I like.
Sometimes I like to train my eyes for certain patterns by scrolling through the replay funtion of a chart. Here the candles pop up pretty much at the very right side of the chart, almost next to the price broder.
Is it possible to somehow change the distance the candles will pop up from the right side of the chart when I scroll through back data, so that it will look more like when I watch real time charts, which is more to the center of the chart?
I have attached a chart. Here you can see how I like to look at charts. On current data the new formed candles will pop up in the center. But when using back data the candles will move the very right edge and appear from there. I would like to have the candles apear more to the left also. Is this possible to accomplish?
Comment