Announcement

Collapse
No announcement yet.

Problem with volume charts??

Collapse
X
 
  • Filter
  • Time
  • Show
Clear All
new posts

  • Problem with volume charts??

    I have been e-mailing chart images with a friend who is also using eSignal volume charts with the same settings I am using (EST, 500V, dynamic 24hr) and discovered that our charts look different - sometimes VERY different.

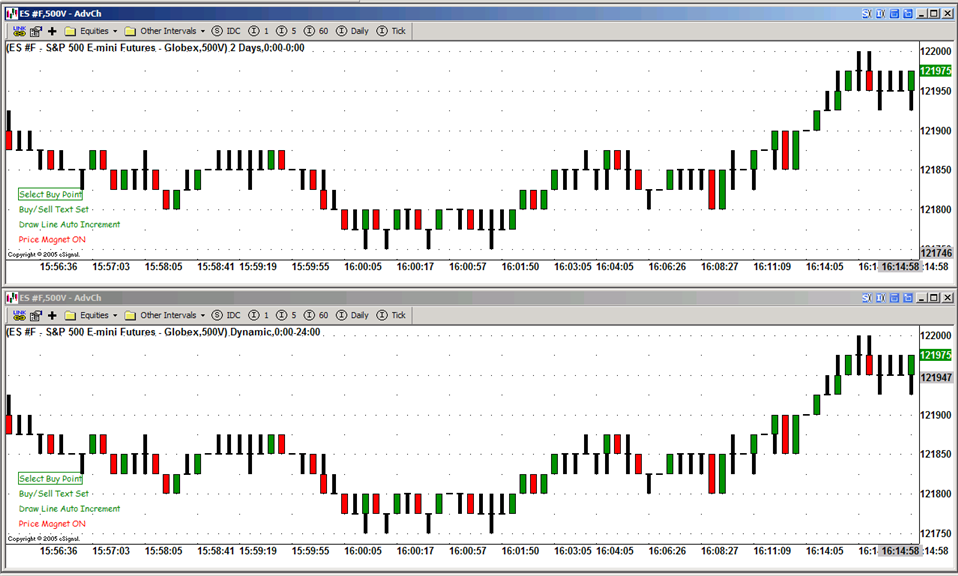
    Today (Saturday) I started eSignal to run a tick replay. I started it again later in the day and noticed something odd. To double-check myself, I screen captured my chart, then restarted eSignal and screen captured again. I created a composte of both (attached).

    Please explain the descrepencies in the charts to me. The market is closed and there is no data updating it. It is the same chart on the same PC (therefore the same settings) but it shows differently separate times.

    The charts are not only NOT consistent between my friend's eSignal and mine, now they are not consistent on my own PC.

    Why is this the case and how can I know that the data is good and being displayed properly?
    Attached Files

  • #2
    Genx,

    First, what are the times on the bars on the different volume charts.

    Just a guess, but if you had data loaded on a chart in tick replay, reset it, then select play again, the bars may be out of sync.

    Why don't you try executing Tick replay in a new eSignal session, then take a screenshot. Restart eSignal, and repeat, see if the charts are still out of sequence.

    Finally, what version of eSignal are you using?

    Comment


    • #3
      Time is on the bottom of the chart

      The composite chart I posted has the time listed along the bottom.

      These are supposed to be 500V bars - 500 contracts per bar.

      Also, the charts do NOT show tick replay data. The desire to run a tick replay was merely the reason I had started eSignal on Saturday.

      The charts show the load of my "live" chart on first startup. This is the data eSignal is presenting as current and valid for Friday 09/02.

      The chart shows that the 2 different times I started eSignal on Saturday, the data bars displayed differently. I composited the 2 screen caps on on top of the other for easy reference.

      Comment


      • #4
        Version

        I am using 7.91 Build 732

        Comment


        • #5
          The chart shows that the 2 different times I started eSignal on Saturday, the data bars displayed differently. I composited the 2 screen caps on on top of the other for easy reference.
          I had assumed that the individual bars had different start times and end times, which I believed would be visible and would explain the different bar ranges. Evidently you verified that before you created your composite screen captures. Sorry I could not help. Perhaps someone else has a better idea as to the nature of your problem.

          FWIW, here is the composite image that I was thinking of (I did not have the problem you mentioned)

          Comment


          • #6
            I have submitted Q to tech support

            Thanks anyway for looking. I filled out a tech support form and referenced this thread to give them more details.

            Comment

            Working...
            X