Announcement

Collapse
No announcement yet.

point and figure charts

Collapse
X
 
  • Filter
  • Time
  • Show
Clear All
new posts

  • point and figure charts

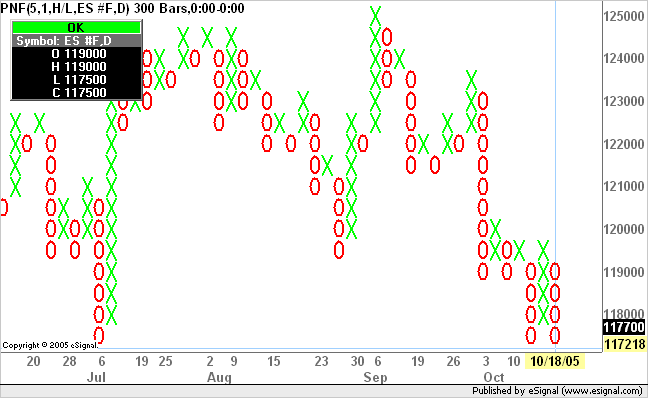
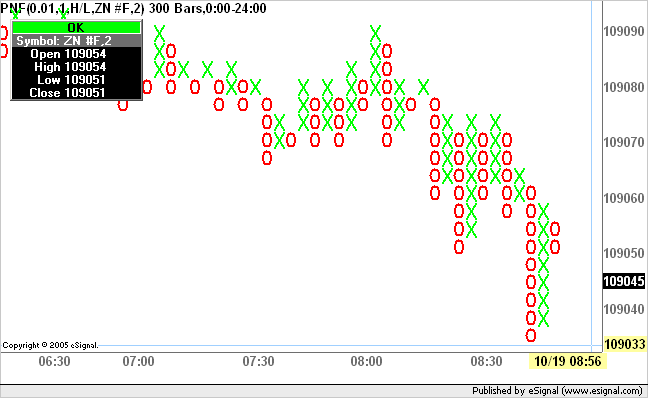
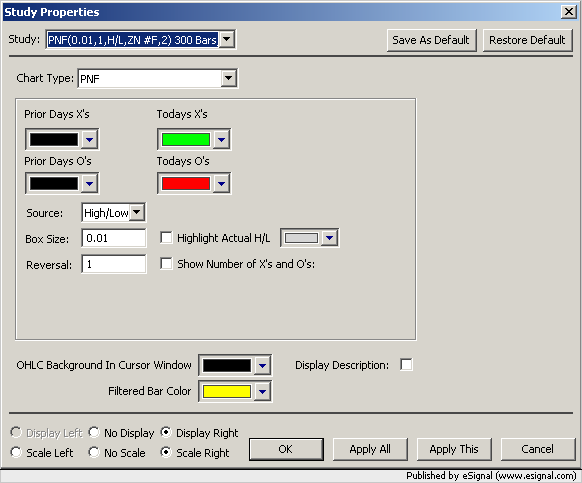
    I can't get point and figure charts to load on Esignal. It takes a long time to gather data, and then it doesn't reallly load at all, I just see a couple of large x's and o's. Has anyone seen it work, and any suggestions on how to make it work?
    thank you

    Jason

  • #2
    Jason
    What symbol/interval are you trying to load? Depending on those you may need to adjust the Box Size. In the image enclosed below for example the Box Size is set to 5 on a daily chart of ES #F
    Alex

    Comment


    • #3
      i am trying to load the 10yr note future, and i do not know how to change the box size. i am opening up my default advanced chart, which is a 2min bar chart, and then loading the pf chart, and it doesn't work.

      Jason

      Comment


      • #4
        Jason
        Right click the chart, select Edit Studies and in the Studies Properties you will find the settings for the Box Size and the amount of boxes required for a reversal. Start with 0.01 and 1 and adjust from there (see images below)
        Alex


        Comment


        • #5
          Jason
          You can find more information on P&F charting in this article in the eSignal KnowledgeBase.
          You may also want to view the videos on Chart Types which is available here
          Alex

          Comment


          • #6
            thank you very much. what does the .01 correspond to, in regards to the typical pf box sizes (anything greater than one)?

            Jason

            Comment


            • #7
              Jason
              That is the size of the box expressed in points. You would need to adjust that to reflect the value of a tick in the 10yr Notes (0.015625)
              Alex

              Comment

              Working...
              X