Announcement

Collapse
No announcement yet.

Chart Scale Inversion ?

Collapse
X
 
  • Filter
  • Time
  • Show
Clear All
new posts

  • Chart Scale Inversion ?

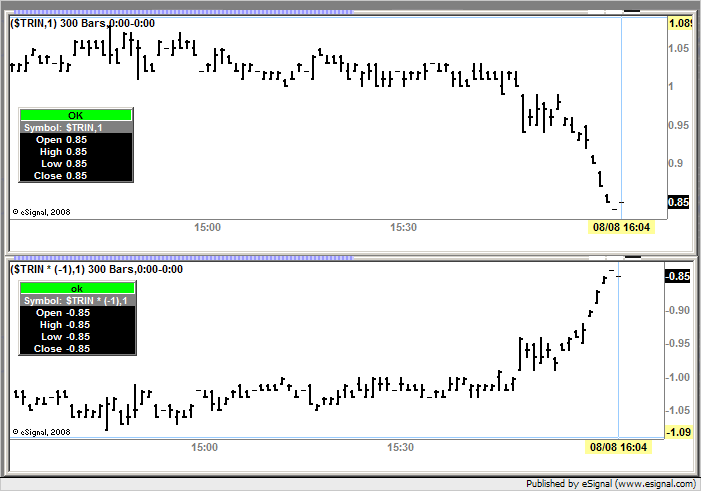
    Hello all, I was wondering if anyone knew how to invert the scale for an esignal chart. In other words, high numbers below price and lower numbers above.
    I would very much appreciate any help- I wish to apply the invert to the TRIN and other inverse indicaors.
    thanks!
    Peter

  • #2
    Checkout the BRIN Indicator/Study (inverted TRIN) at the following:

    http://forum.esignalcentral.com/show...highlight=Brin

    Comment


    • #3
      Peter
      There is no function currently available in eSignal to invert the price scale. Using the Custom Spread Settings tool you could however invert the plot of a symbol by calculating its inverse ie 1 / $TRIN or by converting it to a negative value ie $TRIN * (-1)
      For information and instructions on the Custom Spread Settings tool see this article in the eSignal KnowledgeBase
      Alex

      Comment


      • #4
        Invert Y-Axis feature?

        I found this previous post by searching for 'invert' because I also would like the ability to invert the Y-axis for inverse indicators.

        Lacking an invert Y-axis feature, I currently do use 1 / $TRIN but then the resulting y axis values don't relate to discussions of real TRIN values.

        Did this feature become available since the previous post? (If not, hopefully its in the list of things-to-do?).

        Shaeffer

        Comment


        • #5
          Re: Invert Y-Axis feature?

          shaeffer
          To my knowledge the feature has not become available. In the mean time if you want to invert the chart and maintain the values you could multiply the symbol by (-1) as I suggested in my previous reply to Peter
          Alex


          Originally posted by shaeffer
          I found this previous post by searching for 'invert' because I also would like the ability to invert the Y-axis for inverse indicators.

          Lacking an invert Y-axis feature, I currently do use 1 / $TRIN but then the resulting y axis values don't relate to discussions of real TRIN values.

          Did this feature become available since the previous post? (If not, hopefully its in the list of things-to-do?).

          Shaeffer

          Comment


          • #6
            Thanks Alex,

            Using $TRINQ * (-1) worked much better than 1 / $TRINQ . And I'm guessing it might also be less CPU intensive.

            But a strange thing happened. After the $TRINQ * (-1) chart was appearing correctly, I overlayed it with $TRIN * (-1) by using that formula in the Spread Symbol Settings. They appear ok together, even when I stretch out the Y-axis. But then when I use Autoscale, only the TRIN chart squeezes back into the viewable area - I only see the bottom half of the TRINQ chart.

            Is that normal? Both charts are set to Scale Left / Display Left (if that matters).

            And speaking of stretching, since these values can not go above 0, is there a way to limit the chart from displaying above 0 (as with the setStudyMax() command in an efs)?

            Thanks
            Shaeffer

            Comment


            • #7
              Hi Alex,

              Is Auto Scale All a version 10+ feature? I can't see it in my version 8.0

              Regards
              Shaeffer

              Comment


              • #8
                shaeffer

                Is Auto Scale All a version 10+ feature? I can't see it in my version 8.0
                Yes AutoScale All was introduced in version 10.x
                Regardless it would not be relevant in this case which is why I pulled my previous reply [I misread your post and thought you were referring to a formula]

                But a strange thing happened. After the $TRINQ * (-1) chart was appearing correctly, I overlayed it with $TRIN * (-1) by using that formula in the Spread Symbol Settings. They appear ok together, even when I stretch out the Y-axis. But then when I use Autoscale, only the TRIN chart squeezes back into the viewable area - I only see the bottom half of the TRINQ chart.
                Is that normal? Both charts are set to Scale Left / Display Left (if that matters).
                I repeated the same steps using version 8 and as far as I can see clicking AutoScale resets the scale of both symbols.
                You may need to post some screenshots of your chart and of the scale settings in Edit Studies [of each symbol] for someone to try to replicate what you are seeing
                Alex


                Originally posted by shaeffer
                Hi Alex,

                Is Auto Scale All a version 10+ feature? I can't see it in my version 8.0

                Regards
                Shaeffer
                Originally posted by shaeffer
                Thanks Alex,

                Using $TRINQ * (-1) worked much better than 1 / $TRINQ . And I'm guessing it might also be less CPU intensive.

                But a strange thing happened. After the $TRINQ * (-1) chart was appearing correctly, I overlayed it with $TRIN * (-1) by using that formula in the Spread Symbol Settings. They appear ok together, even when I stretch out the Y-axis. But then when I use Autoscale, only the TRIN chart squeezes back into the viewable area - I only see the bottom half of the TRINQ chart.

                Is that normal? Both charts are set to Scale Left / Display Left (if that matters).

                And speaking of stretching, since these values can not go above 0, is there a way to limit the chart from displaying above 0 (as with the setStudyMax() command in an efs)?

                Thanks
                Shaeffer

                Comment


                • #9
                  Hello Alex

                  Here is the chart with everything looking good.

                  There are four entities in the chart:
                  - TRINQ
                  - moving average of TRINQ
                  - INVERSETRIN [$TRIN 8 (-1)]
                  - background color efs

                  Everything is Scale Left, Display Left. By stretching the Y-axis as required, everything fits nicely
                  Attached Files

                  Comment


                  • #10
                    .. continuation of previous message

                    Then when I click AutoScale, the image appears as below.

                    I've tried removing the efs and the same thing happens. I've changed all four entities to Scale Right, Display Right and the same thing happens.

                    Since you couldn't replicate the issue, I just made a new chart with only the two symbols (with -ve Y scales) and still the same thing happens. So the issue isn't related to my MA or the efs. Even in a 3rd chart without -ve y scales only the $TRIN is completely visible after an autoscale.

                    Well ... I just stumbled on the solution. On a whim I clicked the Scale Price Data Only button and AutoScale now works. Funny that the overlayed symbol was considered as the Price, and the primary sysmbol not. Anyway, problem solved.

                    Cheers
                    Shaeffer

                    p.s. these were scrolled back a little to Thursday, to remove a wild candle extreme
                    Attached Files
                    Last edited by shaeffer; 08-17-2008, 11:38 AM.

                    Comment

                    Working...
                    X