Announcement

Collapse
No announcement yet.

Study Projections

Collapse
X
 
  • Filter
  • Time
  • Show
Clear All
new posts

  • Study Projections

    Dear Experts:

    Can anyone say if eSignal 7.3 will allow studies that are projected forward into time to be completely displayed? eSignal 7.2 will not display the last data points of the studies projected forward in time since it stops the display at the last price bar. I need to see the behavior of the entire study.

    Thanks;

    Burt

  • #2
    Hi Bert,

    Many studies are based on price, thus a lack of price would throw off the indicators. With that being said, what studies would you want extended out into the future? I'm just a little unclear as to what you're looking for here. This info will give me a better understanding to pass on to our engineers as I don't believe what you're looking for is in the works for 7.3.

    Thanks,
    Andy

    Comment


    • #3
      Projections Details

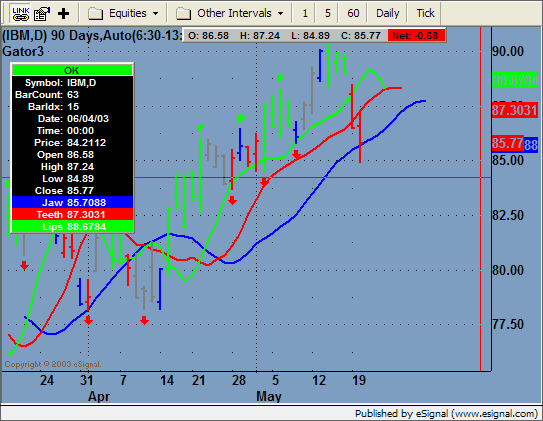
      Thanks Andy. I have attached an image of my desired result. eSignal 7.2 allows moving averages to be projected forward in time but does not display the last data-points in those projections past the last price bar even though data exists based on the price bars on the display. As you may notice in the attached image, the projected moving averages are displayed for 8, 5 and 3 days past the last price bar even since they were calculated using data in prior price bar positions. Have I managed to clarify things at all here? It’s really important to analyze the behavior of the moving average depictions for my analysis.

      Regards;

      Burt
      Attached Files

      Comment


      • #4
        Burt,

        In using the current beta I am able to recreate this effect of offset studies in eSignal's Advanced Chart (see below). Please make sure that you are able to see the forward projection by either scrolling the chart or having a right margin set in chart properties (Chart Options -> Properties).
        Attached Files
        Regards,
        Jay F.
        Product Manager
        _____________________________________
        Have a suggestion to improve our products?
        Click Support --> Request a Feature in eSignal 11

        Comment


        • #5
          Stuey Projections from Formula

          Greetings JayF:

          Thanks so much for the reply. I installed version 7.3 (Beta) and just as you indicated, the display of the shifted moving averages works perfectly for studies put on the Advanced Chart. My displays run from a formula and they do not display the same behavior. I have attached a screenshot that shows what happens; the moving average I created (that mimics one from the formula) extends, but my three moving averages do not. Any clues on what I can do in my formula to get the desired effect?

          Thanks;

          Burt
          Attached Files

          Comment


          • #6
            Hello Burtz,

            If I understand you correctly, you’re saying that you have an EFS formula that draws 3 MAs. Is that correct? The built-in MA study listed in Basic Studies will project the MA into the future by the specified offset. An EFS formula only draws MA lines for the current bar by default. If you want an EFS generated MA to draw on future bars, you'll need to draw each line segment with the drawLineRelative() function. You can read more about this function in our EFS Help Center & Library under the EFS Function Reference folder (see Drawing Functions). If you want some help coding this routine, post your formula here and I'll be happy to assist you.
            Jason K.
            Project Manager
            eSignal - an Interactive Data company

            EFS KnowledgeBase
            JavaScript for EFS Video Series
            EFS Beginner Tutorial Series
            EFS Glossary
            Custom EFS Development Policy

            New User Orientation

            Comment


            • #7
              Greetings JasonK:

              Thanks so much for the reply. You have exactly identified my problem. I am not much of a programmer, but I cobbled together a formula that is doing most of what I want it to do (with the exception of the problem of portraying the moving averages into the future). As I understand how my formula works, it plots the lines on return from the formula, thus I have not used a drawLine() function of either the Absolute or Relative variety. I would be ever so grateful if you could help me understand how to append the necessary logic. I have attached my formula in the hope that you can help even those of limited skill.

              Thanks So Much;

              Burt
              Attached Files

              Comment


              • #8
                Hello Burt,

                I've made the changes to your formula for you. Please take a look at lines 121-143. You now have your MA lines drawn on the future bars using the drawLineRelative() function.

                gator 4a.efs

                Jason K.
                Project Manager
                eSignal - an Interactive Data company

                EFS KnowledgeBase
                JavaScript for EFS Video Series
                EFS Beginner Tutorial Series
                EFS Glossary
                Custom EFS Development Policy

                New User Orientation

                Comment

                Working...
                X