 Tweet
Tweet
Hello all,
I have a question about your Williams %R indicator.
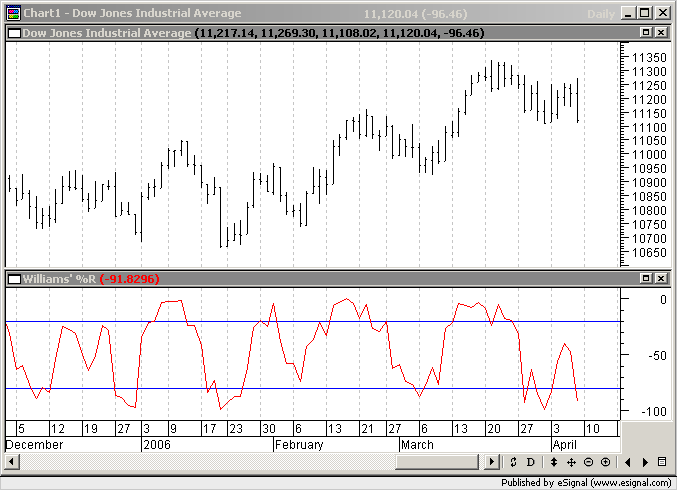
It seems that the %R indicator is displayed "Upside Down."
That is, the 0 area (overbought) is on top, while the -100 area (oversold) is on the bottom.
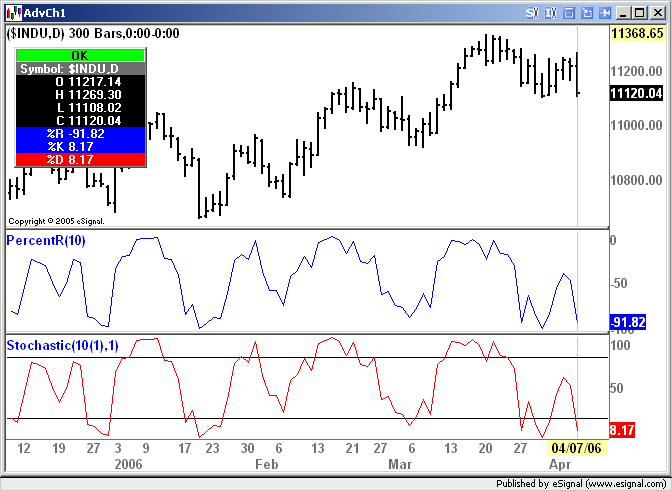
In most other charting platforms, the display is reversed, with the 100 area being on top, and the 0 area on the bottom.
I was just wondering if there was a way to reprogram the indicator, so that the display is reversed, with 100 on top and 0 on the bottom.
Your help would be greatly appreciated.
Thank you very much for your time and attention.
I have a question about your Williams %R indicator.
It seems that the %R indicator is displayed "Upside Down."
That is, the 0 area (overbought) is on top, while the -100 area (oversold) is on the bottom.
In most other charting platforms, the display is reversed, with the 100 area being on top, and the 0 area on the bottom.
I was just wondering if there was a way to reprogram the indicator, so that the display is reversed, with 100 on top and 0 on the bottom.
Your help would be greatly appreciated.
Thank you very much for your time and attention.
Comment