Announcement

Collapse
No announcement yet.

fixed time period chart

Collapse
X
 
  • Filter
  • Time
  • Show
Clear All
new posts

  • fixed time period chart

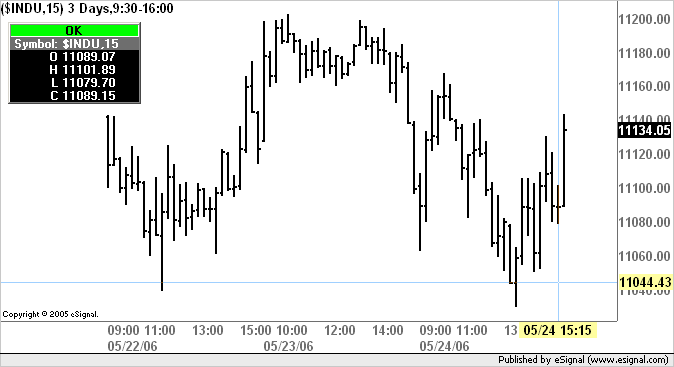
    Is it possible to create a chart that always shows a fixed time period and adjusts the bar width and spacing to compensate for different window sizes?

    For example I'd like a chart that shows 3 days of 15 min. bars at a time even when I maximize or shrink the chart.

    thanks.

  • #2
    chud
    You do that through a Time Template by defining the number of days to load.
    In the Time Template example shown below the chart will always load 3 days of data for any intraday interval (see also chart)
    For information and instructions on how to use Time Templates see this article in the eSignal KnowledgeBase
    Alex


    Comment


    • #3
      I played with the time templates, but that appears to load only 3 days worth of data, but does not change the bar width or spacing to accomodate changing the window size.

      I would like to load all the data but only have 3 days visible in the window at a time. If I maximized the window, the bars would be wide with big spaces between them. If I made the window small, the bars would be narrow with small spacing.

      Is that possible?

      Thanks.

      Comment


      • #4
        chud
        There are two ways you can change the bar spacing.
        One is to click the two icons Increase Bar Spacing and Decrease Bar Spacing that are in the Advanced Chart ToolBar

        The other is to click and drag right or left the X-Axis to decrease or increase the spacing
        Alex

        Comment


        • #5
          Ok. I'll do it that way. Thanks for the help.

          Comment

          Working...
          X