 Tweet
Tweet
How does esignal pick a POC price when there are multiple prices with the same # of TPOs for the day? Using a 5 minute TPO, on 8/11 RTH 3 prices had 27 TPOs, 1268.75 1268.5 and 1271. How (why) did esignal draw its line at 1268.75 and not 1271?
-
-
Hi trend,
From my experience, in cases where we see identical lines of TPO counts, the POC is designated to the line that has the most volume. If you have a particular symbol in mind, please let me know and we can confirm it with the engineering folks. Thanks. -
Duane,
I confirmed that with tech suport earlier today. That is why the POCs have been wrong on days where multiple prices have the same number of TPOs.
I emailed the CBOT to confirm my beliefs and the correct way to pick the POC when multiple prices have the same # of TPOs is the price closer to the midpoint of the value area.
They wrote "In case of a tie....The point of control would be the one closest to the midpoint of the value area.
Sincerely,
CBOT.com Support"
Could that be corrected?
Also is there a way to add a function so that virgin POCs (POC that price has not traded at during regular market hours since the day it was formed) would have a line drawn to the right axis along with the date the POC was formed? I would draw a horizontal line myself but that function has also been removed.
ThanksComment
-
Hi Trend,
Thanks for the info. Let me get some feedback from the Product Development Team and we'll begin researching the behind the scenes calculation of the POC. Thanks!Comment
-
any updates please post here txComment
-
Duane, 1 more follow up
The Market Profile chart displays the POC on the top along with some other data in the TPO SUMMARY. When I change to a 5 minute timeframe, the line showing the POC changes but the # on the TPO SUMMARY do not. I can only assume it still shows the standard 30 minute POC.
2 questions.
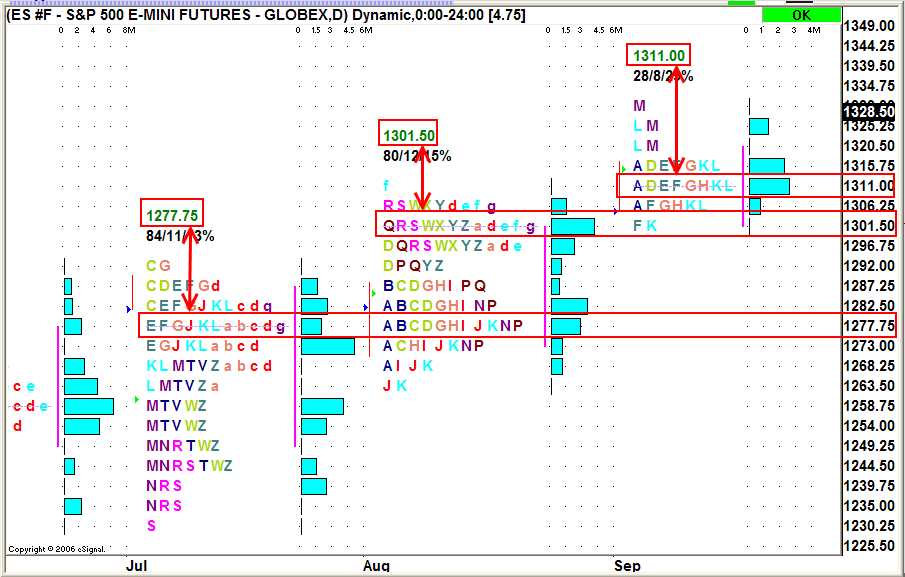
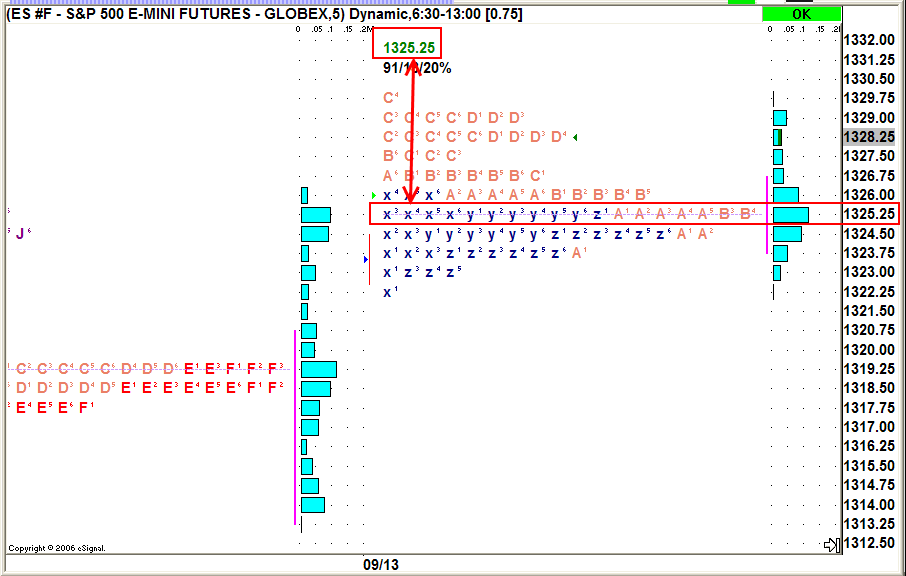
1) Is there a way for that # on top (TPO SUMMARY) to display the POC according to the current charts parameters (time frame, time template etc). ON ES #F 5 minute chart 9:30-16:00 EST on 9/11/06 the time template shows the POC at 1310.00 but the POC in the TPO summary for the same day shows 1311.00. On 9/16 the TPO summary shows teh POC at 1306.5 but the blue line shows the POC at 1305.25.
2) Since the code for this is not open, is it possible for me to pull this number (5 minute POC) off the chart and put t in a list until that price has been traded in a subsequent day, showing all virgin or untouched POCs for a set amount of time back, say 6 months, then maybe draw a line for these virgin POC on another chart?
ThanksLast edited by trend; 09-12-2006, 10:04 AM.Comment
-
Hi Trend,
Can you check which version of eSignal you are currently running? I've tried this with both daily charts and 5-minute intervals and the POC is matching the TPO Summary in both cases. Can you let me know which version and we'll go from there. I'm running eSignal 8.0 Build 779. Thanks.
Daily
5-Minute Interval
Comment
-
Duane,
Thank you. I am running version 7.91 build 738.
Here is a screenshot I posted
also is it possible to have an efs read the pocs off the market profile chart or would I have to code the entire mp process into an efs?Comment
-
Hello trend,
EFS does not currently have access to the POCs. To the best of my knowledge, the exact MP process from the MP widows will not be possible through EFS. Please feel free to submit a request to our development team at [email protected] to investigate the possibility of giving EFS access to MP results.Originally posted by trend
also is it possible to have an efs read the pocs off the market profile chart or would I have to code the entire mp process into an efs?Jason K.
Project Manager
eSignal - an Interactive Data company
EFS KnowledgeBase
JavaScript for EFS Video Series
EFS Beginner Tutorial Series
EFS Glossary
Custom EFS Development Policy
New User OrientationComment
-
Tx jason
Thanks Jason. The esignal MP is very lacking compared to what others offer. You cant draw a line on the charts. You cant access the information, most competitors MP products have a feature to automatically draw a line from untouched POCs to the current day on a candle or bar chart, not just the mp chart. On esignal you cant do that with either candle or mp charts. Its almost like it is a seperate program.
There are a lot of things that need updating in regards to MP charts to make them a more useful tool for eSignal subscribers.Last edited by trend; 09-13-2006, 07:49 PM.Comment
-
Duane,
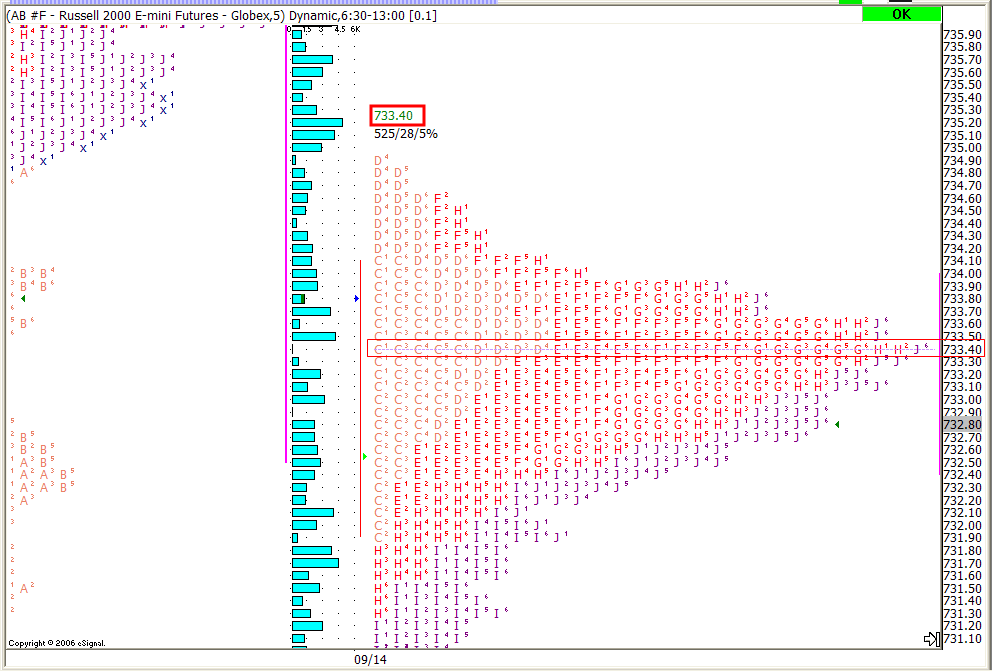
Todays AB #F 5 min chart, 9:30-16:00 time template shows 733.60 in the time template and the blue line is at 733.40. Not a lot off but it is different.
Thanks for looking into this.Comment
-
Hi Trend,
I checked this and I am seeing the POC being displayed at the 733.40 level. I'm not sure of the Y-Axis scaling you have set, but you may need to expand this to see the true price intervals at which the POC was established. Hope this helps.Attached FilesComment
-
-
Duane,
Thansk for your prompt responce, this is driving me nuts. I always make sure my axis shows every tick. The ES trades .25. Your axis is off on the AB #F. The ER2, symbol AB #F, trades in .10 increments. I have it strected to see that. You only show increments in .20. See if your POC in the TPO summary matches teh blue line POC when you expand it. Thanks

Also how did you draw a line on the MP chart? I cant get line tools for them.Comment
-
Trend,
I took another screenshot last night with the correct tick increment. Both the TPO Summary and the POC are being displayed at the 733.40 level. What version of eSignal are you currently running?
The lines that I drew on the Market Profile chart I posted were done with a screen capture program. I was working with an image of the profile, not the profile itself.Comment
-
Duane,
Thanks for that info on drawing the line. That is what I did. I thought you had a trick to draw within the esignal MP chart.
I am running version 7.91 build 738. Not the newest but new enough to be accurate and supported. I have the right tick and no idea why my #s dont match. I feel like im in the twighlight zone lol thanks for the help.Comment

Comment