Announcement

Collapse
No announcement yet.

Volume data for #f vs #f=2

Collapse
X
 
  • Filter
  • Time
  • Show
Clear All
new posts

  • Volume data for #f vs #f=2

    When I add the suffix #f=2 to a daily chart of ES or NQ in order to see only regular trading hours, I do not see volume bars. But if I use #f, I do get volume bars. Unfortunately, #f gives after-hours price and volume data as well as data from regular trading hours. I tried using an intraday chart with 405 minute bars and setting the time to 9:30-16:15 EST. This gives both price and volume but only returns 60 days worth of data. Is there any way to show a daily chart with volume bars and more than 60 days' data?

    Thanks in advance.

  • #2
    I just realized one more problem with using the #f=2 suffix: it only returns about 15 months worth of daily bars (even if I set the number of days as more than that), whereas #f returns much more.

    Any suggestions for working around this problem as well?

    Comment


    • #3
      aereoplain

      With regards to the ES #F=2 volume issue you mention (which also applies to NQ #F=2 BTW), I think the problem is due to the fact that the minis are effectively a single session and that the CME does not provide a breakdown of the volume data.
      In fact you will notice that also ES M3=2 does not show any volume data.

      So what I did was to load a 405 minute chart for ES and compared that volume to the one on the daily which includes all sessions. With few exceptions the difference between the two ranges between 5 and 10%.
      NOTE: If you do this comparison remember that the volume that appears on the 405 min chart for a given day will be the one posted on the next day in the daily.

      Therefore if you find that this difference is within an acceptable margin and the volume of the full session is representative of the daily session then a possible solution would be to use the attached EFS for your ES #F=2 daily charts.
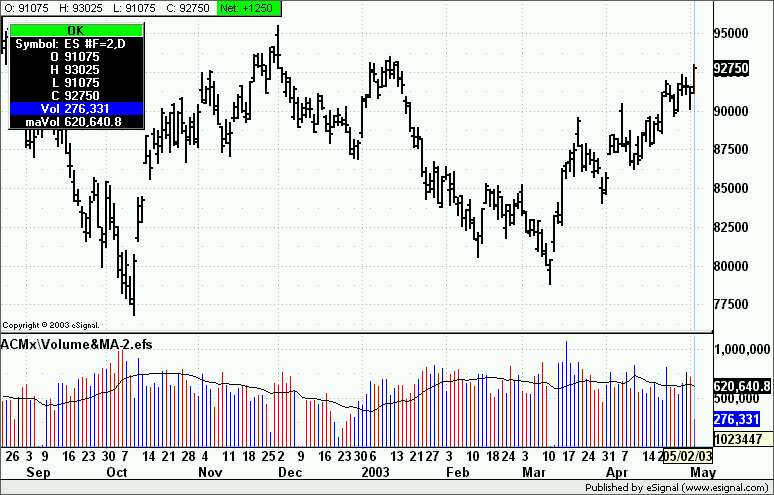
      This EFS will plot the volume of ES #F and also a 20 period moving average of the volume as you can see in the image below.
      If necessary you can change the source symbol for the volume and the length of the MA by going to Edit Studies.

      Hope this helps

      Alex

      Attached Files

      Comment


      • #4
        Alex,

        The 5-10% difference in volume shouldn't be significant for my backtesting purposes. I'll give it a try!

        Thanks,
        aereoplain

        Comment

        Working...
        X