buzzhorton
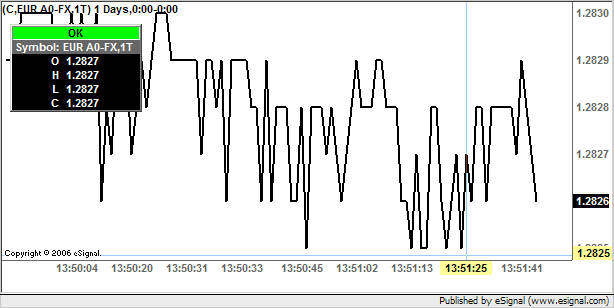
You can also display it as a bar type chart (ie Candle, Bar or Line) by using 1T as the interval (see image).
Note however that whereas T will plot both Bid and Ask since it is displaying the true updates, 1T (and other intraday intervals) will only plot the Bid. This is because a bar type chart is based on trades and since there are no trade transactions in eSignal's Forex feed (but only Bid/Ask) eSignal maps the Bid to Last for charting purposes.
This is also why when you plot the close(0) of a Forex symbol it will return the values of the Bid only
Alex
 Tweet
Tweet
Comment