Announcement

Collapse
No announcement yet.

wrong percent change sign in quote window for neg spreads

Collapse
X
 
  • Filter
  • Time
  • Show
Clear All
new posts

  • wrong percent change sign in quote window for neg spreads

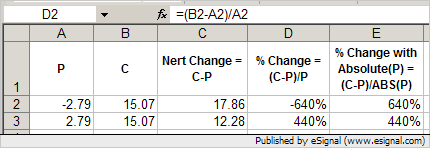
    For spreads that have negative values, the Change and Pct columns show the correct color, but the Pct column shows a plus sign when it should be a minus sign and vice versa. There's a - in front of a green number and a + before a red number in the Pct column for the negative spreads as the screenshot shows .

    8.0 build 782 on Windows 2000 Pro here.
    Attached Files

  • #2
    checkraise
    Unless my math is incorrect when using negative numbers a negative Net Change should correspond to a positive Percent Change and viceversa. If for example yesterday the spread was -1 and today the spread is -2 the Net Change is -1 but the Percent Change is +100%. Conversely if the spread was at -2 yesterday and at -1 today the Net Change is +1 and the Percent Change is -50%
    You should be able to verify this using a daily chart running a 1 period Momentum study which represents the Net Change and a 1 period ROC study which represents the Percent Change
    In the Quote Window however the color for the Percent Change cell is determined by that of the Net Change
    Alex

    Comment


    • #3
      Thanks Alex. Your math is correct of course. But as you've shown, using the percent change formula for positive numbers, and applying it to negative numbers, can give wacky results. This link discusses calculating percent changes when the base is a negative number. Tricky stuff when negative numbers are involved. One of my spreads went from -2.79 to +15.07 the next day, but the ROC(1) shows a percent change of negative 640% for that day. Mathematically, this is correct according to the formula used, but it makes no sense that such a huge positive gain for that day would compute to a huge percentage loss. If the spread had moved from +2.79 to +15.07 that day, the ROC(1) would be +440%. But the spread moved more than that, and from a smaller base (-2.79 < +2.79), so by my thinking the ROC(1) should be larger than +440%. But should it be +640%? Well, if the spread had moved from +0.01 to +15.07, the ROC(1) would be +1506%. But again, the spread moved more than that and from a smaller base, so logically the percent change should be greater than +1506%. And more of this kind of wackiness occurs in losses, where closing below zero can lead to percent losses in excess of 100%.

      I think to avoid this kind of mess, for my spreads that dip into the negs I'll shift the chart up by adding a constant to the spread and get rid of the negs completely.

      Thanks again for your input.

      Comment


      • #4
        checkraise
        Based on the alternate workaround mentioned in the link you posted (ie using the modified Percent Change calculation of (Current-Previous)/Absolute(Previous) instead of (Current-Previous)/Previous) the values would be 640% and 440%. You can see the result of this in the enclosed screenshot of an Excel sheet
        Regardless I agree that modifying the spread with a constant so that it deals with positive numbers only is the better solution.
        Alex

        Comment

        Working...
        X