Announcement

Collapse
No announcement yet.

Creating custom Time frames

Collapse
X
 
  • Filter
  • Time
  • Show
Clear All
new posts

  • Creating custom Time frames

    I have noticed with a normal candle or bar chart - that is, say, a 5 min bar chart, it is quite easy to create a custom time frame that would, for example, dismiss the night session of wbs 7q-ice so I could view the highest volume data in that regard ; say from 8:00 -13:30 CST.
    My question is: do I have ANY control over; amount of days, amount of bars, ANY time parameters using Tick chats?

    Thanks,

    Graham Davis
  • #2
    Graham
    See the reply to a similar question posted in this thread
    Alex

    Comment


    • #3
      Ok, I understand about time frames when it comes to tick charts but I am not able to either get smaller or larger than 2 days of tick data.
      Graham

      Comment


      • #4
        -

        Graham
        You control that through the Time Template by defining the # Days to be loaded for the specific T interval.
        For information on Time Templates and how to use them see this article and this video in the eSignal KnowldgeBase.
        Alex

        Comment


        • #5
          I am having trouble with smalling down the numbers of days AFTER I load a higher # of days into the symbols memory as relates specifically to tick charts.
          For instance : I loaded a 2 day tick chart of wbs 7q-ice and that was no problem. Then I changed the time template feature to have 1 day 2 day 3 day all the way to 10 day specifically for tick charts only. I bumped up the 2 day to 10 days and I recieved 10 days of tick data. That works great if you are using a large number of ticks for you're charts, say, 2000T chart - but if you are using smaller tick numbers like 133T charts, 10 days is obviously an overkill and just eats system resourses.
          So I had this WTI chart up with 10 days loaded. I then went to right click and select a 2 day template, but no matter what I did, I kept getting 10 days worth of data.
          So then I tryed using the 2 day template on another symbol - specifically AB #F and loaded it for 2 days. It worked fine, Then I loaded it for 5 days and all I got was 3 days worth of data then the real test was to see if I could "small down" the data. I selected data for 1 day and I still recieved 3 days worth of data.
          It seemes like there is a cache for this data which allows you to go up but not back down in terms of Tick data.
          I want to be able to have a number of charts open at one time - I might have 10 chats open for 1 symbol and the different time frames that I am looking at for each synbol need to be taylored specifically to that chart. So I might have WTI in a 2000T window, which will require quite a few days of tick data. In the other windows of WTI, I might use 533T, 333T, 133T and then various intraday 5 minutes 15 60 120 240... But if I am loading 10 days for the 2000t chart and using some smaller charts, like I do, say, 66t, 133t, 333t, I only want a day or 2 max loaded up. I may have been repetative in my explanation - I just want to make sure I am getting the problem out there, so it's understood.
          Thanks,
          Graham Davis

          Comment


          • #6
            re- to yesterdays post on TF

            I just want to emphasize to Alexis and anyone else out there who is knowledgeable about these things, that I have read the forum links suggested by Alexis from 6-28-07. The post that I wrote yesterday (7-14-07) came after much effort. I have tryed many things over and over and this is seemingly not working correctly.

            Sincerely,

            Graham Davis
            Last edited by GDAVIS01; 07-15-2007, 06:30 PM.

            Comment


            • #7
              Graham
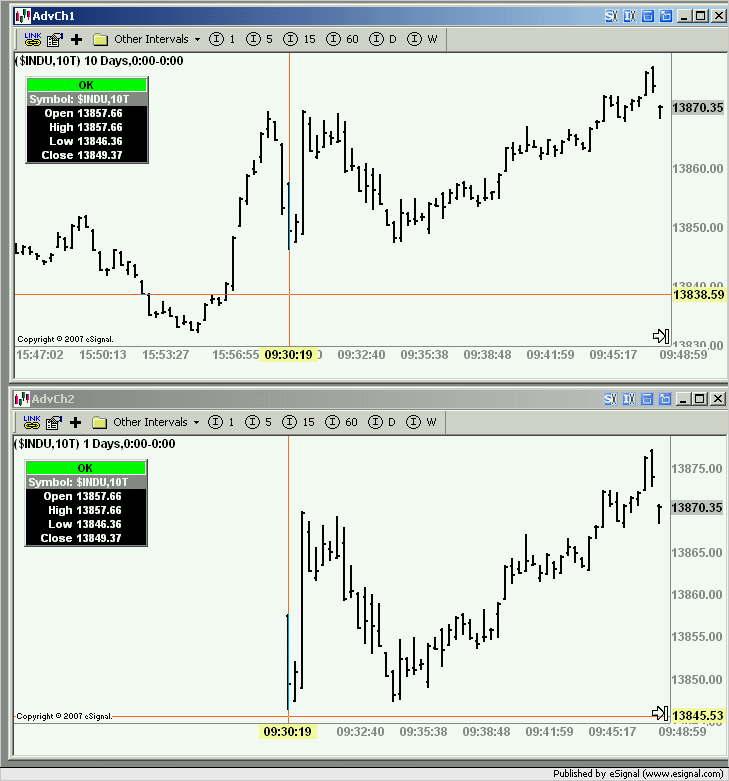
              As you have already found out if you create a tick chart based on a certain number of days and then create another chart based on a different Time Template that is set to use a lesser number of days the latter will make use of all the cached data regardless of the Time Template settings.
              In order for that chart to load a lesser number of days you need to refresh it by clicking the green OK box in the Cursor Window while pressing the Ctrl key. This will create a new data request and download only the appropriate number of days (see as an example the screenshot enclosed below which shows two charts based on different Time Templates each one loaded with a different number of days)
              Alex

              Comment


              • #8
                Thanks Alexis -that works perfectly.

                Is there anyway to alphabetize the listing in time frames or reorder them by number sequence. I have half hazard time frames - in the order I created them by. Or do I half to start over and create them just the way I want them to appear?

                Thanks,

                Graham D

                Comment


                • #9
                  Graham
                  Which time frame listing are you referring to? The one in the Time Template or the one in the Favorites bar?
                  Alex

                  Comment


                  • #10
                    Graham,

                    I read your post and intrigued by your use of so many different time frames for a given symbol.

                    I also use several charts per symbol when analyzing a market but found that "analysis paralysis" sets in when I have too may charts open while trading as there is the inevitable conflict of indicators, chart patterns etc.

                    Was wondering if you cared to share your take on the topic?

                    I just recently stated using tick charts in an attempt to normalize the data throughout low and high market time periods which will hopefully improve several strategies I am using.

                    Was wodering how you came upon using the tick intervals you posted 133t 233t etc, as these numbers seem quite common?

                    Thanks,

                    Glen
                    Glen Demarco
                    [email protected]

                    Comment


                    • #11
                      Hi Alexis,

                      I am refering to both really, though the favorites seem to do a better job then the templates section which I cannot organize. In the favorites part if there is a way to group tick time frames and intrady time frames to keep them separate that would be nice. I guess I could create another folder - 1 for tick and 1 for intraday - so... then how to fix the templates area. The way it is listed in the edit area is the same way it appears when you right click on a chart and select you're tie frame.

                      Thanks,

                      Graham D

                      Comment


                      • #12
                        Graham
                        You can rearrange the order of the Time Templates and their contents by using an XML editor to edit the TimeTemplates.xml file that is in the eSignal folder. Make sure to make a copy of your current Time Template file before implementing any changes
                        Alex

                        Comment


                        • #13
                          As Alexis showed below, it is possible to limit the number of days of data loaded into a standard tick chart, e.g. 10T or 100T. But I have yet to been able to impose the same limitation on a 60S chart. Is it possible to load only one day of tick data into a 60S chart? Thanks.

                          Mike

                          Comment


                          • #14
                            Mike
                            In the Time Template create a User Defined interval using the letter S (or s) as the Interval and set the # Days to 1
                            That will load 1 day of seconds-bars.
                            Alex


                            Originally posted by mikejhelms
                            As Alexis showed below, it is possible to limit the number of days of data loaded into a standard tick chart, e.g. 10T or 100T. But I have yet to been able to impose the same limitation on a 60S chart. Is it possible to load only one day of tick data into a 60S chart? Thanks.

                            Mike

                            Comment


                            • #15
                              Damn, it's embarressing to be stumped by such a simple thing. Don't tell anyone I asked.

                              Mike

                              Comment

                              Working...
                              X