Announcement

Collapse
No announcement yet.

problems with es tick charts

Collapse
X
 
  • Filter
  • Time
  • Show
Clear All
new posts

  • problems with es tick charts

    hi,

    i'm having a problem displaying tick charts for the es. i can pull up tick charts for nq and ym with no problem but for es it seems to either take a while or they just don't show up at all. the cursor window will show a green "ok".

    i'm using the latest version of esignal.

    please advise.

    thx
  • #2
    Hi Jay,

    That's a strange one, though from time to time I'll get an occurrence like that. Let me ask a few questions to see if we can find out more about this.

    Was this just today, or has this been going on for awhile?

    Did this happen just now after market close, or was it happening during market hours?

    The chart you use, is it one that you have been using for a while? Saved & reused? Or was it a new chart?

    Do you have any efs studies applied to it? Though NQ & YM may come right up, there's so much more volume on ES than the rest that it will take longer to load. Specially if you're using efs studies on the tick chart.

    Let's start with those questions to see what we need to look at next.

    Thanks,
    Andy

    Comment


    • #3
      I see the same thing every once in a while.

      What I do is change to a 5 min chart, let it fill in and then revert back to the desired tick chart. Usually fills in shortly, but a definite lag has been seem.

      I run w2k so I dont reboot that often, and that seems to be part of the issue. The lag is most prononced when eSignal s reloaded.

      Comment


      • #4
        Originally posted by AndyS
        Hi Jay,

        That's a strange one, though from time to time I'll get an occurrence like that. Let me ask a few questions to see if we can find out more about this.

        Was this just today, or has this been going on for awhile?

        Did this happen just now after market close, or was it happening during market hours?

        The chart you use, is it one that you have been using for a while? Saved & reused? Or was it a new chart?

        Do you have any efs studies applied to it? Though NQ & YM may come right up, there's so much more volume on ES than the rest that it will take longer to load. Specially if you're using efs studies on the tick chart.

        Let's start with those questions to see what we need to look at next.

        Thanks,
        Andy
        hey andy,

        problems have been for a while now. they are not just limited to market hours. i'm just running candles at different ticks (ie 300t, 500t) with no other studies at all. i've tried both saved/reused charts as well as new charts.

        usually the es tick charts will load after about a minute of starting up esignal. actually it seems right now i can't get any charts!! i'm gonna reinstall esignal to see it that helps.

        thx

        Comment


        • #5
          just reinstalled esignal... i got my ym tick charts almost right away but had to wait about 3-4 minutes before my es tick charts popped up and that was after retyping "300t" a couple of times. after i got the 300t es chart up, i retyped "500t" and that es chart popped up.

          Comment


          • #6
            Hi - I'm doing a trial of signal and I get similar behavior. Tick charts on E-minis are pretty much useless. Same with P&F (on a tic chart!). Both lock the CPU at 100%.

            I notice that when I try to bring up the tick chart, it will load some initial data and update correctly. But within mins, the hourglass sticks and the CPU on my machine shoots up to 100% and stays there.

            I've left it for a couple mins and then just killed esignal. I've never seen it come out of this state once it enters. As long as I avoid tick charts, other chart intervals run fine.

            Comment


            • #7
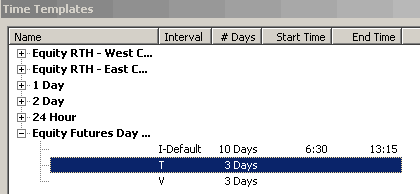
              This is commonly seen on the ES due to the sheer volume of ticks required to download before the chart is seen. My suggestion is to limit the data downloaded via a Time Template. This can be done by using the # Days field in the Time Templates window. Below is a screenshot of the settings I use.


              This FAQ is available to assist with creating Time Templates.
              Regards,
              Jay F.
              Product Manager
              _____________________________________
              Have a suggestion to improve our products?
              Click Support --> Request a Feature in eSignal 11

              Comment


              • #8
                for some reason i can't pull up 2 min charts on the es right now... i can pull up just about every other time frame (1,3,4,5,6,7,8...) but i can't get 2min!!

                pls help.

                thx

                Comment


                • #9
                  Can esignal run on a MAC w/ emulation software?

                  Are there any esignal users anywhere that know anyone that runs esignal on a mac OS system? I would appreciate any feedback. and what pc emulation software they use to run it if smoothly at all??

                  Thanks

                  Comment


                  • #10
                    Originally posted by jay
                    for some reason i can't pull up 2 min charts on the es right now... i can pull up just about every other time frame (1,3,4,5,6,7,8...) but i can't get 2min!!

                    pls help.

                    thx
                    I would suggest closing the affected chart window, and then opening a new one. Alternatively, you can try to refresh the chart window by holding down the CTRL key, and clicking the Ok button on the Cursor Window.
                    Regards,
                    Jay F.
                    Product Manager
                    _____________________________________
                    Have a suggestion to improve our products?
                    Click Support --> Request a Feature in eSignal 11

                    Comment


                    • #11
                      Hi Jay - Thanks a lot for your reply.

                      unfortunately, I can't get it to work! As far as I can tell, time templates do not have an effect on tic charts. I can force an interval chart to only retrieve a limited amount of bars or time, but the tic chart always loads what it wants (and clogs up).

                      Please let me know if I am missing something or any other tips to get a small tic chart to load quickly!

                      Thanks,

                      According to signal's FAQ:


                      "Can I use time templates in advanced tick charts?

                      Currently the time templates do not work on advanced tick charts."

                      Comment


                      • #12
                        Originally posted by cwhitak
                        Hi Jay - Thanks a lot for your reply.

                        unfortunately, I can't get it to work! As far as I can tell, time templates do not have an effect on tic charts. ...

                        Please let me know if I am missing something or any other tips to get a small tic chart to load quickly!

                        Thanks,

                        According to signal's FAQ:


                        "Can I use time templates in advanced tick charts?

                        Currently the time templates do not work on advanced tick charts."
                        My apologies for not specifying before. The Time Template work-around works for tick charts such as 300T, 500T, etc. One way around the issue of tick charts not using Time Templates is to use the 1T, effectively creating bars with 1 tick each.
                        Regards,
                        Jay F.
                        Product Manager
                        _____________________________________
                        Have a suggestion to improve our products?
                        Click Support --> Request a Feature in eSignal 11

                        Comment


                        • #13
                          Tick Charts

                          Hi,

                          When will trend lines and drawing tools work on tick charts??

                          John

                          Comment


                          • #14
                            We're working on getting line tools for tick charts into the 7.4 release. They aren't in the current beta build but they will likely be in the next build for testing. 7.4 is expected to be ready for official release in mid July.

                            Thanks.

                            Comment

                            Working...
                            X