Hi,
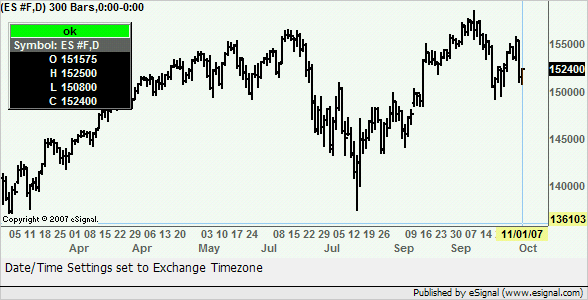
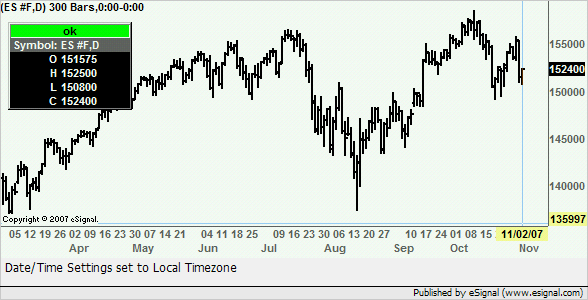
When I open an advanced chart versus a standard chart (whether graph or tabular), all daily data is back-dated by one day !?
The same holds for data exports.
e.g. QQQQ Close is 54.00 on standard chart and csv export file for 11/01/07, on advanced chart for 10/31/07.
On the advanced chart, the rightmost vertical dotted line suggests that the last bar occured on the first day of a new month. The detailed OHLC window gives the same wrong date. Some months on the horizontal axis are late by a full month and every other month label occurs double while every succeeding month does not show.
Jan and Feb are late by 1 month, Mar does not show. Apr is on time, but occurs twice. May is late by one month. un is missing. Jul is on time again, but occurs twice etc.
Since I only use these charts from time to time to verify other data streams, it is confusing, but not critical. On the other hand, I have not checked any other configurations for similar discrepancies.
As a matter of principle though, these kinds of inconsistencies can be very dangerous for automated trading, since who is to tell which data set is correct? Trading with data and indicators that are one bar off could be devastating.
This could of course be a visual glitch, and all data sent trough the feed could be 100% correct.
Please confirm. Thanks.


Comment