Is e-signal able to chart combined volume for a future? For example, corn. Can the total volume for all contracts both pit and electronic be charted? Also, can total combined OI also be charted? The CBOT and CME provides this info daily.
Announcement
Collapse
No announcement yet.
combined volume chart
Collapse
X
-
Re: combined volume chart
cpt351
eSignal has a specific symbol format to plot the aggregate Volume and Open Interest of futures. These are
[root symbol][space][#V] for aggregate Volume (eg ES #V)
and
[root symbol][space][#OI] for aggregate Open Interest (eg ES #OI]
You can find this and other information in this article in the eSignal KnowledgeBase
Hope this helps
Alex
Originally posted by cpt351
Is e-signal able to chart combined volume for a future? For example, corn. Can the total volume for all contracts both pit and electronic be charted? Also, can total combined OI also be charted? The CBOT and CME provides this info daily.
-
cpt351
FYI the symbol formats are also provided in the Symbol Formats Guide in the eSignal KnowledgeBase
Alex
Comment
-
cpt351
You are most welcome
I believe you already have that data if you use the composite symbol(s).
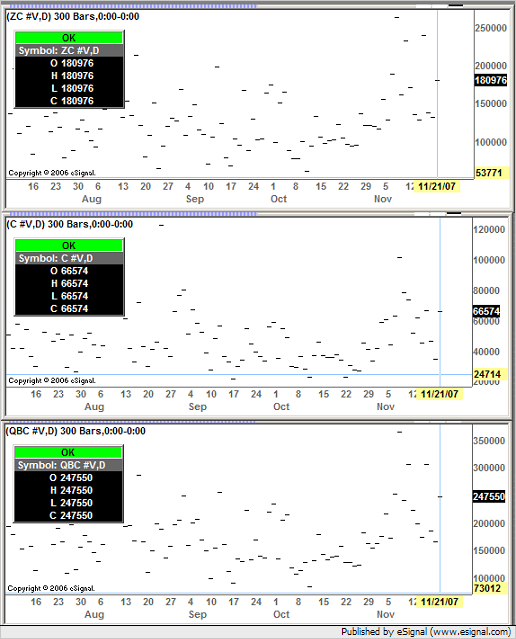
For Corn for example the composite root symbol is QBC so if you run QBC #V you get the aggregate of both pit and electronic traded contracts (see enclosed screenshot)
In the eSignal folder you should have a Quote Window for all the available composite symbols. If not you can download it from the eSignal Sample Quote Window Files group in FileShare. The file name is Composite Futures.quo
Alex

Originally posted by cpt351
Thanks Alex. That was helpful. They should consider combining pit volume with electronic volume to get the complete picture.
Comment
-
cpt351
At this time there isn't an option to plot histogram bars in the price chart. You could try using a Line chart as an alternative
If you are familiar with programming in efs you could write a formula that will plot those values as an indicator (similar to a volume study). If not and you need someone to write the script for you then you may want to review the FAQ: How can I get my custom study built?
Alex
Originally posted by cpt351
Can e-signal use a bar chart that is similar to the regular volume bar chart so it is clearer?
Comment
Comment