Announcement

Collapse
No announcement yet.

Industry Group & Sectors

Collapse
X
 
  • Filter
  • Time
  • Show
Clear All
new posts

  • Industry Group & Sectors

    Hi,
    I'm a newbie to eSignal and trying to find my around. Apologies if this topic is covered elsewhere, but my searches haven't yielded any answers thus far.

    In the Trader's Toolbox I see there are lists of industries and sectors with their component stocks, so that if one is 'drilling down' it's possible to find stocks within a given sector. However, I can't work out an easy way to do this in reverse. So, take GOOG as an obvious example: how does one find out what sector GOOG is in without laboriously having to scroll through all the sectors lists to see where it resides?

    Hope this is clear and thanks in advance you your help.

  • #2
    Re: Industry Group & Sectors

    P&Fman
    In the Quote, Summary or Detail windows right click the symbol then in the context menu select Research-> S&P Compustat and that should open a browser window with fundamental information (including Sector and Industry) for that stock
    Alex


    Originally posted by P&Fman
    Hi,
    I'm a newbie to eSignal and trying to find my around. Apologies if this topic is covered elsewhere, but my searches haven't yielded any answers thus far.

    In the Trader's Toolbox I see there are lists of industries and sectors with their component stocks, so that if one is 'drilling down' it's possible to find stocks within a given sector. However, I can't work out an easy way to do this in reverse. So, take GOOG as an obvious example: how does one find out what sector GOOG is in without laboriously having to scroll through all the sectors lists to see where it resides?

    Hope this is clear and thanks in advance you your help.

    Comment


    • #3
      Hi Alexis,
      Thanks for that - easy when you know how! I have another question, unrelated to my first one, but seeing as I've got your attention . . . ;-)
      Bar and candle charts are great but, unhappily for me, Point & Figure charts are a bit of a disaster by contrast. They take ages to load, visually they're all over the place and even managed to crash my PC twice in one session last week! Maybe it's me and I'm doing something stupid - any thoughts?

      Comment


      • #4
        P&Fman
        You are most welcome.
        For someone to be able to assist you with the P&F charts issues you will need to provide some details [preferably using a screenshot of a specific example] in particular with regards to what you mean with "all over the place".
        When posting a screenshot of the chart make sure that the chart title (ie the writing in the upper left corner of the chart) is clearly legible as it contains much of the information related to how the P&F chart is set up (ie Source, Box Size, etc).
        Also - seeing that you are in the UK - you may find it preferable to contact directly eSignal's Support office in London as they are best equipped to identify what could be causing the slowness you are reporting and to offer solutions to resolve that
        Alex


        Originally posted by P&Fman
        Hi Alexis,
        Thanks for that - easy when you know how! I have another question, unrelated to my first one, but seeing as I've got your attention . . . ;-)
        Bar and candle charts are great but, unhappily for me, Point & Figure charts are a bit of a disaster by contrast. They take ages to load, visually they're all over the place and even managed to crash my PC twice in one session last week! Maybe it's me and I'm doing something stupid - any thoughts?

        Comment


        • #5
          Hi Alexis,
          Thanks for such a quick response.
          For someone to be able to assist you with the P&F charts issues you will need to provide some details [preferably using a screenshot of a specific example] in particular with regards to what you mean with "all over the place".
          :-)
          I thought you might request this! This forum works a tad differently to the one I'm used to - but I'll give it a shot. 3 charts, all of AMZN, 5 min, 15 min and 60 min timeframes respectively. All are $0.05 cents, 3 box reversal. I think you'll agree - they are a mess! As I say, no prob's with bar and candle charts - they are the dogs gonads.
          Also - seeing that you are in the UK - you may find it preferable to contact directly eSignal's Support office in London as they are best equipped to identify what could be causing the slowness you are reporting and to offer solutions to resolve that
          I'll hang fire on this for a while Alexis because I'm about to switch my ISP and upgrade my whole system. If that doesn't solve the problem then, yes, I'll get onto your techie colleagues here in the U.K. Thanks for your help - really appreciate it.

          Comment


          • #6
            This forum works a tad differently to the one I'm used to - but I'll give it a shot.
            Once more with feeling . . .
            Attached Files

            Comment


            • #7
              And the 15 min . . .
              Attached Files

              Comment


              • #8
                And the 60 min . . .
                Attached Files

                Comment


                • #9
                  P&Fman
                  Are you referring to the plotted data or to the appearance?
                  As far as the plotted data is concerned I ran some P&F charts on AMZN and IBM and at my end they seem to be fine.
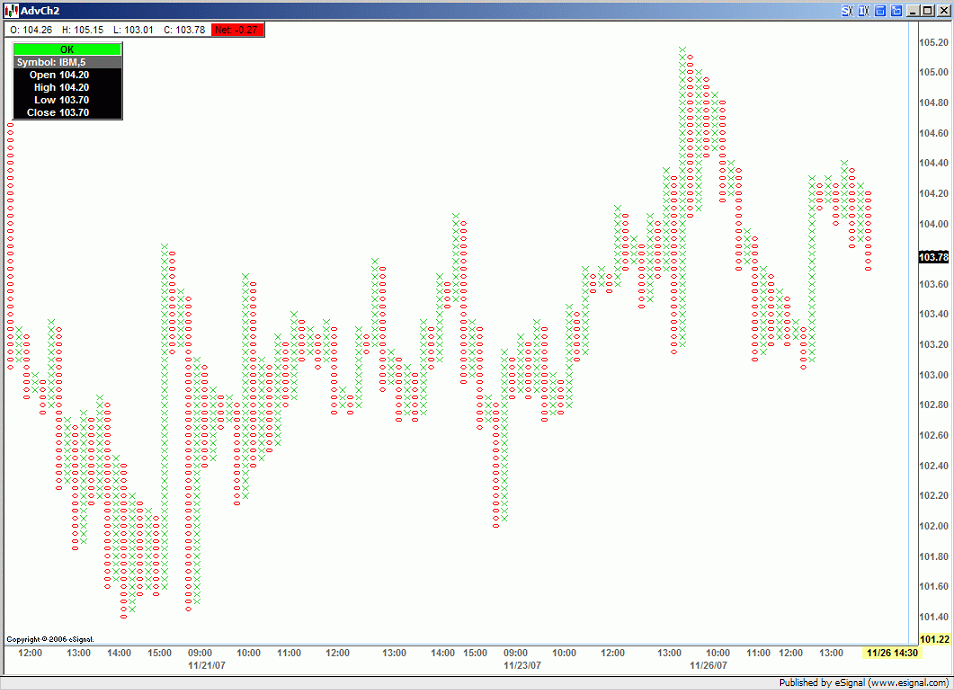
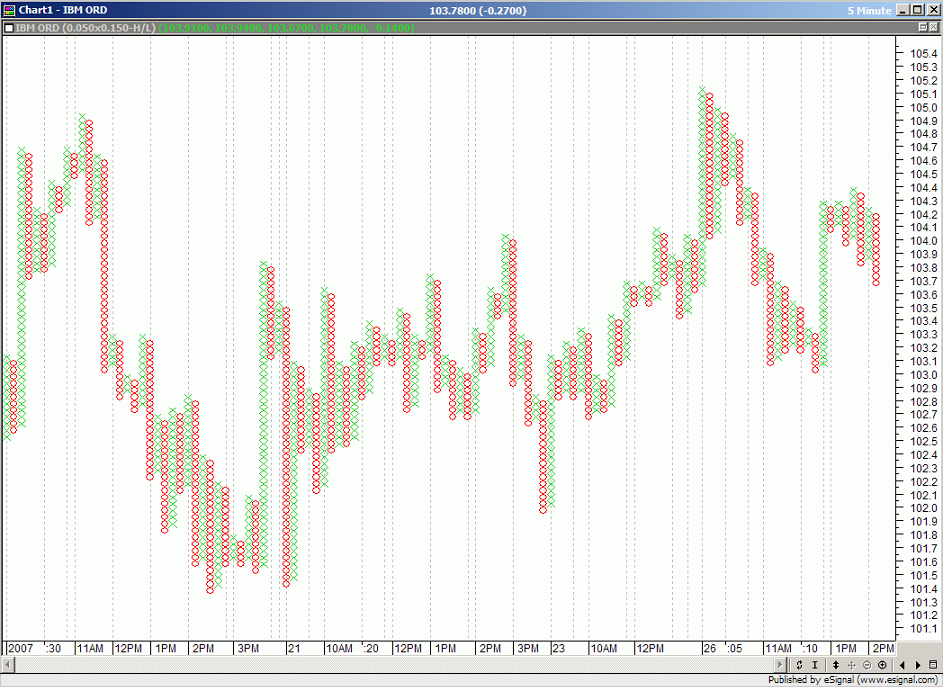
                  I also compared them to Metastock's P&F charts for the same symbols and settings and they appear to be similar other than in a few columns due to differences in the data in the two apps (see enclosed screenshots of the 15 min AMZN and 5 min IBM charts using eSignal and Metastock).
                  Having said that I notice that you are plotting all sessions in your chart ie you are including both pre and post market data which may not be what you are intending to do. If you want to plot data using only the regular trading hours then you need to set up a Time Template to limit the chart between 9:30 and 16:00 EST (or equivalent if in a different timezone).
                  For information on Time Templates and instructions on how to use them you may want to review this article in the eSignal KnowledgeBase.
                  As to the appearance - due to the low value you are using for the Box Size - you may need to reduce the thickness of the columns and increase the vertical spacing and/or increase the size of the chart (see third screenshot from the top as an example).
                  Hope this helps
                  Alex


                  Originally posted by P&Fman
                  Hi Alexis,
                  Thanks for such a quick response.

                  :-)
                  I thought you might request this! This forum works a tad differently to the one I'm used to - but I'll give it a shot. 3 charts, all of AMZN, 5 min, 15 min and 60 min timeframes respectively. All are $0.05 cents, 3 box reversal. I think you'll agree - they are a mess! As I say, no prob's with bar and candle charts - they are the dogs gonads.

                  I'll hang fire on this for a while Alexis because I'm about to switch my ISP and upgrade my whole system. If that doesn't solve the problem then, yes, I'll get onto your techie colleagues here in the U.K. Thanks for your help - really appreciate it.

                  Comment


                  • #10
                    As to the appearance due to the low value you are using for the Box Size.you may need to reduce the thickness of the columns and increase the vertical spacing or increase the size of the chart.
                    Hi Alex,
                    Thanks very much for this. It is the appearance of the charts (and usability or lack thereof) that I was referring to. However, your post makes it clear to me that I'm trying to run before I can walk and that a good few hours spent studying eSignal's KnowledgBase will pay dividends! I appreciate the time and effort invested in your reply - thank you again.

                    Comment


                    • #11
                      P&Fman
                      You are most welcome
                      Alex


                      Originally posted by P&Fman
                      Hi Alex,
                      Thanks very much for this. It is the appearance of the charts (and usability or lack thereof) that I was referring to. However, your post makes it clear to me that I'm trying to run before I can walk and that a good few hours spent studying eSignal's KnowledgBase will pay dividends! I appreciate the time and effort invested in your reply - thank you again.

                      Comment

                      Working...
                      X