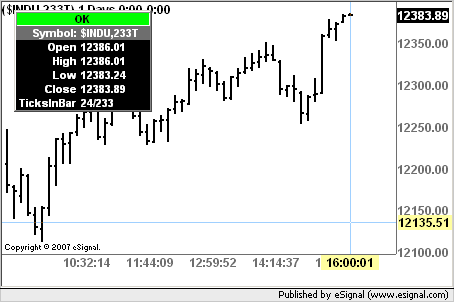
I like to use tick charts, but there is one thing I haven't been able to figure out with esignal software.
On a time chart it's easy to tell when a bar will end. Watch the clock. But on tick charts thats another matter.
On some other platforms, I would just plot tick volume. So if I have a 233 tick chart, then when the tick volume bar approached 233, I knew the bar was close to ending.
I haven't figured out how to do this with esignal. Can anyone help.
Thanks, Pete

Comment