Announcement

Collapse
No announcement yet.

Market Profile missing volume bars

Collapse
X
 
  • Filter
  • Time
  • Show
Clear All
new posts

  • Market Profile missing volume bars

    Hello,
    I have spoken to many different people at Esignal and nobody so far has sorted out this problem I am having setting up my Market Profile.
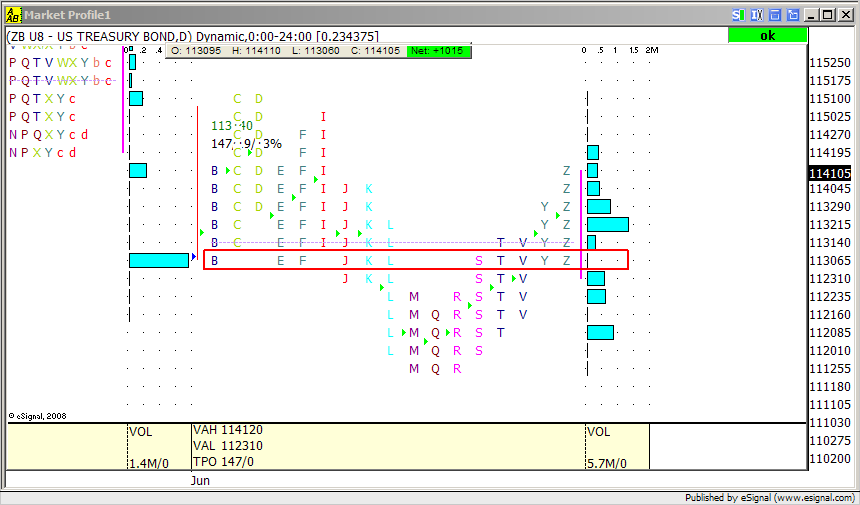
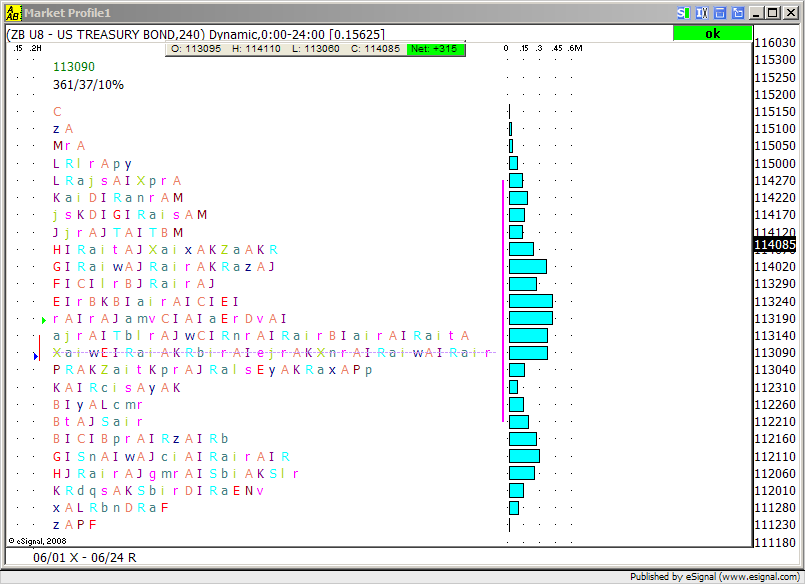
    I want to look at the tnote on a daily time scale, so I enter the code "zn u8" or "zn #f" and enter d for the time scale.
    When I right click and select "volume", the volume bars appear for only a few prices.
    How do I get a volume bar at every price?

    Maybe I'm making a simple mistake, as I am new to Esignal. Anyway, I would really appreciate some help.
    Many Thanks...

    (If I've posted in the wrong forum, please move my thread to the correct one)

  • #2
    OK so I'm getting nowhere with this thread.

    Can anyone suggest where I might be able to get an answer?
    Maybe there's a forum that I've overlooked that specifically deal with such problems?
    Maybe there is a person, an email address, a phone number that I should try?

    Any suggestions would be gratefully received.

    Comment


    • #3
      Did you try a 30 minute price interval, the standard Market Profile interval?

      Comment


      • #4
        Thank you for the reply dloomis.
        Yes I have got the profile working fine on the 30min basis, I just wanted to compile a longer term profile.

        Comment


        • #5
          NowThen
          As I understand it Volume is assigned to the midpoint price of a period. This means that you can have some prices in the profile displaying 0 Volume as they were never the midpoint of any period.
          As an example see the enclosed screenshot of a daily profile of ZB U8 in which I have split the periods. Highlighted in the screenshot is a price level with 0 Volume. As you can see none of the split periods actually have a midpoint (indicated by the right pointing green triangle) at that price level. The same occurs at the other price levels that are showing 0 Volume
          Hope this helps
          Alex

          Comment


          • #6
            Alex, Thank You for your reply.
            The volume bars are simply supposed to record or estimate the number of contracts traded at each price.
            In a fast moving market sometimes a price is skipped, or so few contracts traded at a single price that the chart system may round it down to zero. This rarely happens in the treasury futures.

            If you elongate the chart, in order to see every single price, I think that you will get just a handful of volume bars for the whole month -hardly satisfactory if one is trying to pick out high volume prices.

            Comment


            • #7
              NowThen
              The daily interval is made of a single set of OHLCV quotes hence there isn't a way to determine within that period what the Volume is at each price.
              If you want to increase the granularity of the Volume profile drop down to lower intervals [as David has already suggested to you] and combine the distributions
              For example the enclosed screenshot is a 240 minute chart with the distributions merged from June 1st to today (ie the same period covered in my previous screenshot)
              Alex


              Originally posted by NowThen
              Alex, Thank You for your reply.
              The volume bars are simply supposed to record or estimate the number of contracts traded at each price.
              In a fast moving market sometimes a price is skipped, or so few contracts traded at a single price that the chart system may round it down to zero. This rarely happens in the treasury futures.

              If you elongate the chart, in order to see every single price, I think that you will get just a handful of volume bars for the whole month -hardly satisfactory if one is trying to pick out high volume prices.

              Comment


              • #8
                Thank you for your help Alex.
                Merging standard profiles is a way round the problem.

                However, that the volume bars don't work on the daily time frame means that esignal does not measure up to the functionality available with CQG. Other than that I have been happy with the esignal package.
                Do you work for esignal Alex, or do you know how to report this problem to an enigineer/systems designer in order to sort out this lack of functionality?
                The data is there, the competitors have this functionality, so surely the fix should be fairly simple and straight forward.

                Comment

                Working...
                X