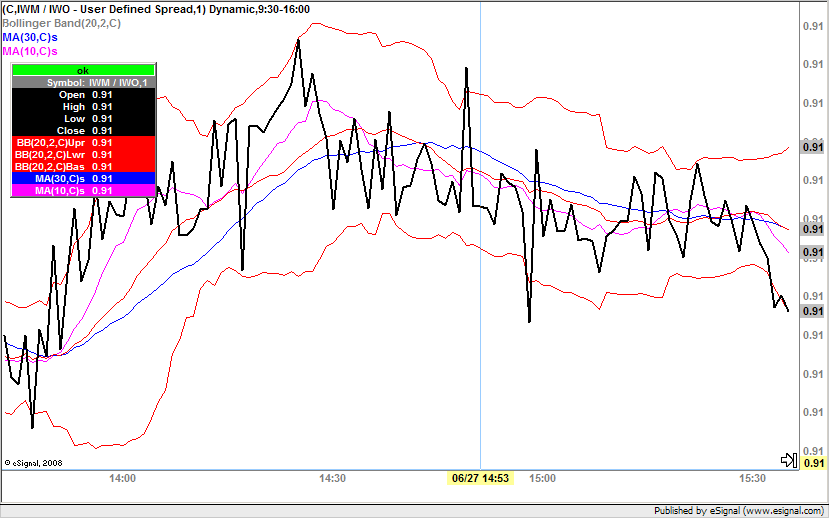
Hi, I want to plot a simple spread chart with simple technical indicators and I have strange results. The moving averages and the Bollinger bands are skewed. See attached screen shot.
Is there something I dont get? Anyways I can fix that? I get similar results on non-spread charts (single stock).

Is there something I dont get? Anyways I can fix that? I get similar results on non-spread charts (single stock).


Comment